

Question: a) Using the descriptive statistics table (below) determine the point estimate of the mean Sold Price of the population of properties. b) Determine a 95%

a) Using the descriptive statistics table (below) determine the point estimate of the mean "Sold Price" of the population of properties. b) Determine a 95% confidence interval estimate of the mean "Sold Price" of the population of properties. c) Provide a brief explanation of the meaning of the confidence interval estimate obtained in part b. d) If the population mean "Sold Price" is actually 650($000), would you consider the interval estimate obtained in part b to be satisfactory? Explain why or why not.
Sold prices: 112, 125, 152, 239.5, 270, 295, 300, 319, 323, 340, 342, 350, 354, 357, 358.5, 374, 375, 385, 387.5, 400, 410, 415, 432.5, 453, 455, 460, 475, 481, 481.5, 510, 525, 544.5, 555, 560, 610, 615, 670, 740, 741, 1126, 1175, 1215, 1606, 1885, 2020 (i.e. 112 = $112,00, 125 = $125,000)
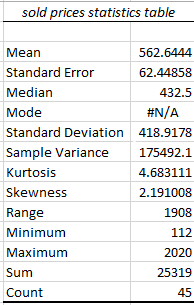
sold prices statistics table Mean 562.6444 Standard Error 62.44858 Median 432.5 Mode #N/A Standard Deviation 418.9178 Sample Variance 175492.1 Kurtosis 4.683111 Skewness 2.191008 Range 1908 Minimum 112 Maximum 2020 Sum 25319 Count 45
Step by Step Solution
There are 3 Steps involved in it

Get step-by-step solutions from verified subject matter experts