

Question: Input your answers directly into this Word document. Do your own tabulations (without Minitab) for this assignment when noted. Type your answers. Handwritten assignments
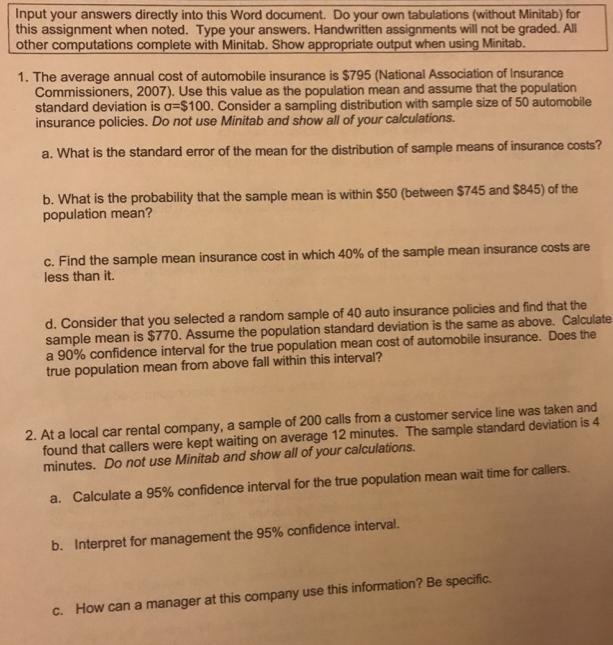
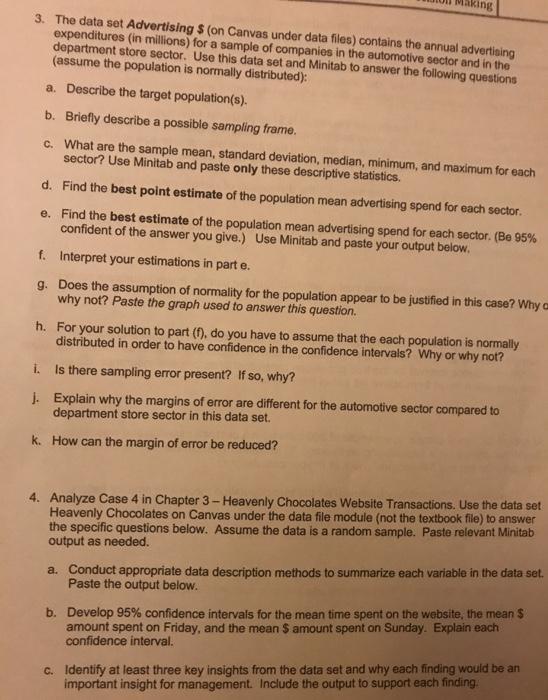
Input your answers directly into this Word document. Do your own tabulations (without Minitab) for this assignment when noted. Type your answers. Handwritten assignments will not be graded. All other computations complete with Minitab. Show appropriate output when using Minitab. 1. The average annual cost of automobile insurance is $795 (National Association of Insurance Commissioners, 2007). Use this value as the population mean and assume that the population standard deviation is a $100. Consider a sampling distribution with sample size of 50 automobile insurance policies. Do not use Minitab and show all of your calculations. a. What is the standard error of the mean for the distribution of sample means of insurance costs? b. What is the probability that the sample mean is within $50 (between $745 and $845) of the population mean? c. Find the sample mean insurance cost in which 40% of the sample mean insurance costs are less than it. d. Consider that you selected a random sample of 40 auto insurance policies and find that the sample mean is $770. Assume the population standard deviation is the same as above. Calculate a 90% confidence interval for the true population mean cost of automobile insurance. Does the true population mean from above fall within this interval? 2. At a local car rental company, a sample of 200 calls from a customer service line was taken and found that callers were kept waiting on average 12 minutes. The sample standard deviation is 4 minutes. Do not use Minitab and show all of your calculations. a. Calculate a 95% confidence interval for the true population mean wait time for callers. b. Interpret for management the 95% confidence interval. c. How can a manager at this company use this information? Be specific. Making 3. The data set Advertising $ (on Canvas under data files) contains the annual advertising expenditures (in millions) for a sample of companies in the automotive sector and in the department store sector. Use this data set and Minitab to answer the following questions (assume the population is normally distributed): a. Describe the target population(s). b. Briefly describe a possible sampling frame. c. What are the sample mean, standard deviation, median, minimum, and maximum for each sector? Use Minitab and paste only these descriptive statistics. d. Find the best point estimate of the population mean advertising spend for each sector. e. Find the best estimate of the population mean advertising spend for each sector. (Be 95% confident of the answer you give.) Use Minitab and paste your output below. f. Interpret your estimations in part e. g. Does the assumption of normality for the population appear to be justified in this case? Why a why not? Paste the graph used to answer this question. h. For your solution to part (f), do you have to assume that the each population is normally distributed in order to have confidence in the confidence intervals? Why or why not? i. Is there sampling error present? If so, why? j. Explain why the margins of error are different for the automotive sector compared to department store sector in this data set. k. How can the margin of error be reduced? 4. Analyze Case 4 in Chapter 3-Heavenly Chocolates Website Transactions. Use the data set Heavenly Chocolates on Canvas under the data file module (not the textbook file) to answer the specific questions below. Assume the data is a random sample. Paste relevant Minitab output as needed. a. Conduct appropriate data description methods to summarize each variable in the data set. Paste the output below. b. Develop 95% confidence intervals for the mean time spent on the website, the mean $ amount spent on Friday, and the mean $ amount spent on Sunday. Explain each confidence interval. c. Identify at least three key insights from the data set and why each finding would be an important insight for management. Include the output to support each finding.
Step by Step Solution
3.42 Rating (158 Votes )
There are 3 Steps involved in it
a What is the standard error of the mean for the distribution of sample means of insurance costs The standard error of the mean is 10 b What is the probability that the sample mean is within 50 betwee... View full answer

Get step-by-step solutions from verified subject matter experts