

Question: a). Using the table located above, compute how many respondents often or sometimes post tweets about the news? What percentage of the sample do they
a). Using the table located above, compute how many respondents often or sometimes post tweets about the news? What percentage of the sample do they represent?
b). How many respondents rarely or never post tweets about the news? What percentage of the sample do they represent?
c). Compute the index of qualitative variation for the data and discuss what they say about how variable Americans are in the frequency of their tweets.
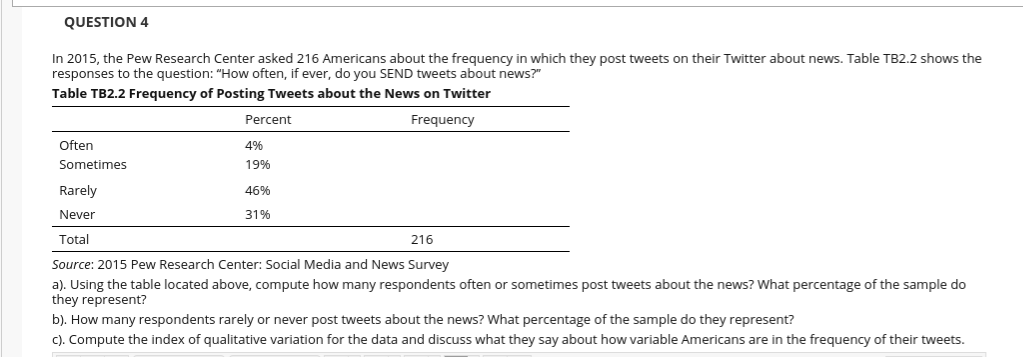
QUESTION 4 In 2015, the Pew Research Center asked 216 Americans about the frequency in which they post tweets on their Twitter about news. Table TB2.2 shows the responses to the question: "How often, if ever, do you SEND tweets about news?" Table TB2.2 Frequency of Posting Tweets about the News on Twitter Percent Frequency Often 4% Sometimes 19% Rarely 46% Never 31% Total 216 Source: 2015 Pew Research Center: Social Media and News Survey a). Using the table located above, compute how many respondents often or sometimes post tweets about the news? What percentage of the sample do they represent? b). How many respondents rarely or never post tweets about the news? What percentage of the sample do they represent? c). Compute the index of qualitative variation for the data and discuss what they say about how variable Americans are in the frequency of their tweets
Step by Step Solution
There are 3 Steps involved in it

Get step-by-step solutions from verified subject matter experts