

Question: a) We go back in time to the very end of 1990 where the US economy was officially in a recession. Use the diagram below
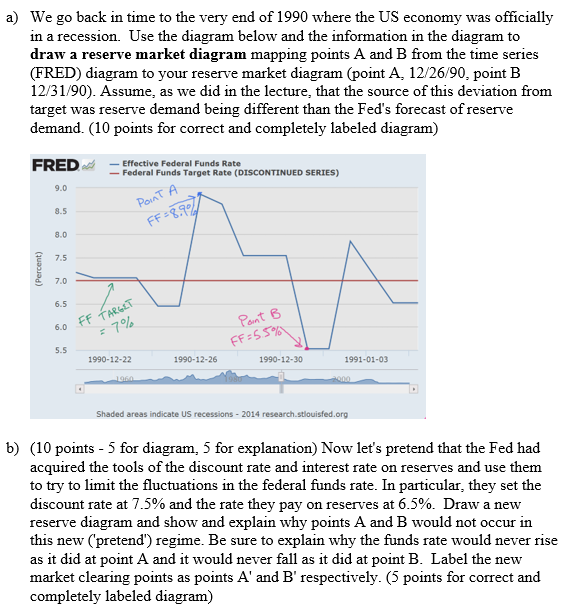
a) We go back in time to the very end of 1990 where the US economy was officially in a recession. Use the diagram below and the information in the diagram to draw a reserve market diagram mapping points A and B from the time series (FRED) diagram to your reserve market diagram (point A, 12/26/90, point B 12/31/90). Assume, as we did in the lecture, that the source of this deviation from target was reserve demand being different than the Fed's forecast of reserve demand. (10 points for correct and completely labeled diagram) FRED - Effective Federal Funds Rate - Federal Funds Target Rate (DISCONTINUED SERIES) 9.0 POINT A 0.5 FF= 8:90 Percent 7.0 6.5 FF TARGET 6.0 = 7% Pant B FF = 5.5% 5.5 1990-12-22 1990-12-26 1990-12-30 1991-01-03 2000 Shaded areas indicate US recessions - 2014 research.stlouisfed.org b) (10 points - 5 for diagram, 5 for explanation) Now let's pretend that the Fed had acquired the tools of the discount rate and interest rate on reserves and use them to try to limit the fluctuations in the federal funds rate. In particular, they set the discount rate at 7.5% and the rate they pay on reserves at 6.5%. Draw a new reserve diagram and show and explain why points A and B would not occur in this new ('pretend') regime. Be sure to explain why the funds rate would never rise as it did at point A and it would never fall as it did at point B. Label the new market clearing points as points A' and B' respectively. (5 points for correct and completely labeled diagram)
Step by Step Solution
There are 3 Steps involved in it

Get step-by-step solutions from verified subject matter experts