

Question: Look at the hospital cost data on slide 14 of the Cost Functions slides. To interpret this data: the values are indices, where 1.00 is
Look at the hospital cost data on slide 14 of the “Cost Functions” slides. To interpret this data: the values are indices, where 1.00 is the average cost for hospitals with 10,000 discharges. For example, the average cost of communications for hospitals with 5000 discharges is listed as 1.22. This means that the average cost of communications with hospitals with 5000 discharges is 122% of the average cost of communications for hospitals with 10,000 discharges (i.e. 22% higher). The final row (“all cost centers” gives the average total cost for the given number of discharges (relative to hospitals with 10,000 discharges).
a) What (approximately) is the minimum efficient scale for hospitals, according to this data? Explain. (You can consider very small differences to be effectively zero when answering this question, and there are at least two answers that could be considered correct).
b) In the range between 2,500 discharges and 10,000 discharges do hospitals exhibit economies or diseconomies of scale, according to this data?
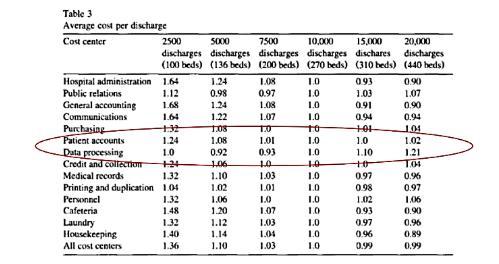
Table 3 Average cost per discharge Cost center 2500 20,000 discharges (100 beds) (136 beds) (200 beds) (270 beds) (310 beds) (440 beds) S000 7500 10,000 15,000 discharges discharges discharges discharges dischares Hospital administration 1.64 Public relations General accounting 1.24 1.08 1.0 093 0.90 1.12 0.98 1.24 1.22 0.97 1.0 1.03 1.07 1.68 1.08 1.0 0.91 0.90 Communications 1.64 1.07 1.0 0.94 0.94 Purchasing Patient accounts Data processing Credit and collecom Medical records Printing and duplication 1.04 Peronnel Cafeteria Laundry Housekeeping To to +01- 1.04 1.24 1.08 1.01 1.0 1.0 1.02 10 0.92 0.93 1.0 1.10 1.21 +24 to Tos 1.32 1.10 1.03 1.0 0.97 0.98 0.96 0.97 1.02 LO1 LO 1.32 1.06 LO 1.0 1.02 1.06 1.48 1.20 1.07 10 0.93 0.90 1.32 1.12 1.03 1.0 0.97 0.96 1.40 1.14 1.10 1.04 1.0 0.96 0.89 All cost centers 1.36 1.03 1.0 0.99 0.99
Step by Step Solution
3.44 Rating (157 Votes )
There are 3 Steps involved in it
a Minimum efficient scale is achieved by a firm when the longrun average cost is in ... View full answer

Get step-by-step solutions from verified subject matter experts