

Question: a. What are the average and standard deviation for the proportion of defects for the last 6 days? b. What are the control limits for
a. What are the average and standard deviation for the proportion of defects for the last 6 days?
b. What are the control limits for the appropriate control charts based on the data collected for the last 6 days?
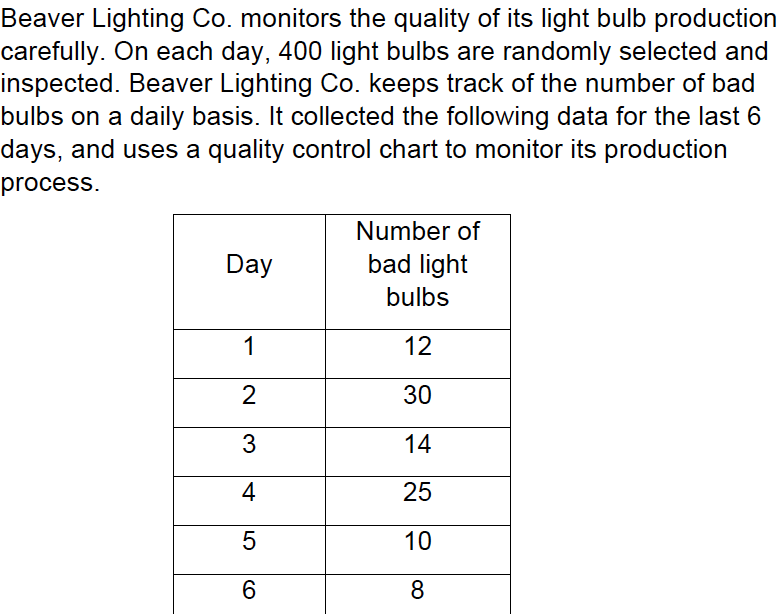
Beaver Lighting Co. monitors the quality of its light bulb production carefully. On each day, 400 light bulbs are randomly selected and inspected. Beaver Lighting Co. keeps track of the number of bad bulbs on a daily basis. It collected the following data for the last 6 days, and uses a quality control chart to monitor its production process. Day Number of bad light bulbs 12 30 14 25 10Step by Step Solution
There are 3 Steps involved in it
1 Expert Approved Answer
Step: 1 Unlock

Question Has Been Solved by an Expert!
Get step-by-step solutions from verified subject matter experts
Step: 2 Unlock
Step: 3 Unlock