

Question: a) What do the data in each graph represent? i) Graph A Distance of School Bus Distance from school (km) from School 16- 12
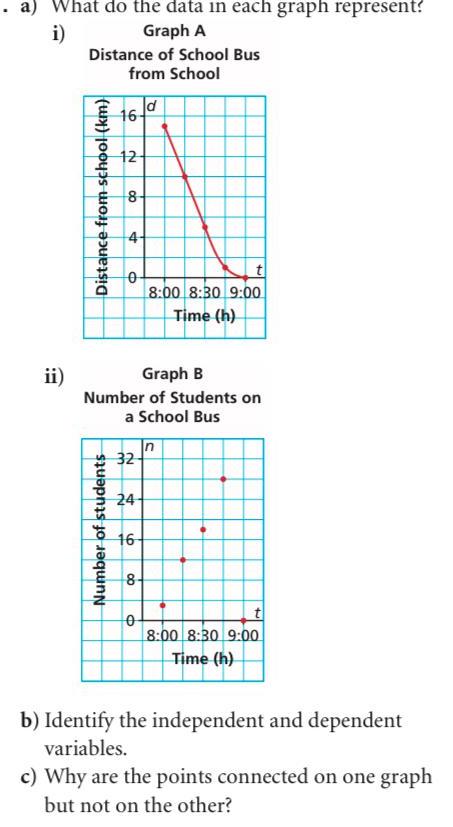
a) What do the data in each graph represent? i) Graph A Distance of School Bus Distance from school (km) from School 16- 12 8 4 d ii) 8:00 8:30 9:00 Time (h) Graph B t Number of Students on a School Bus Number of students n 32 24 16 8- 0 8:00 8:30 9:00 Time (h) b) Identify the independent and dependent variables. c) Why are the points connected on one graph but not on the other?
Step by Step Solution
There are 3 Steps involved in it
1 Expert Approved Answer
Step: 1 Unlock

Question Has Been Solved by an Expert!
Get step-by-step solutions from verified subject matter experts
Step: 2 Unlock
Step: 3 Unlock