

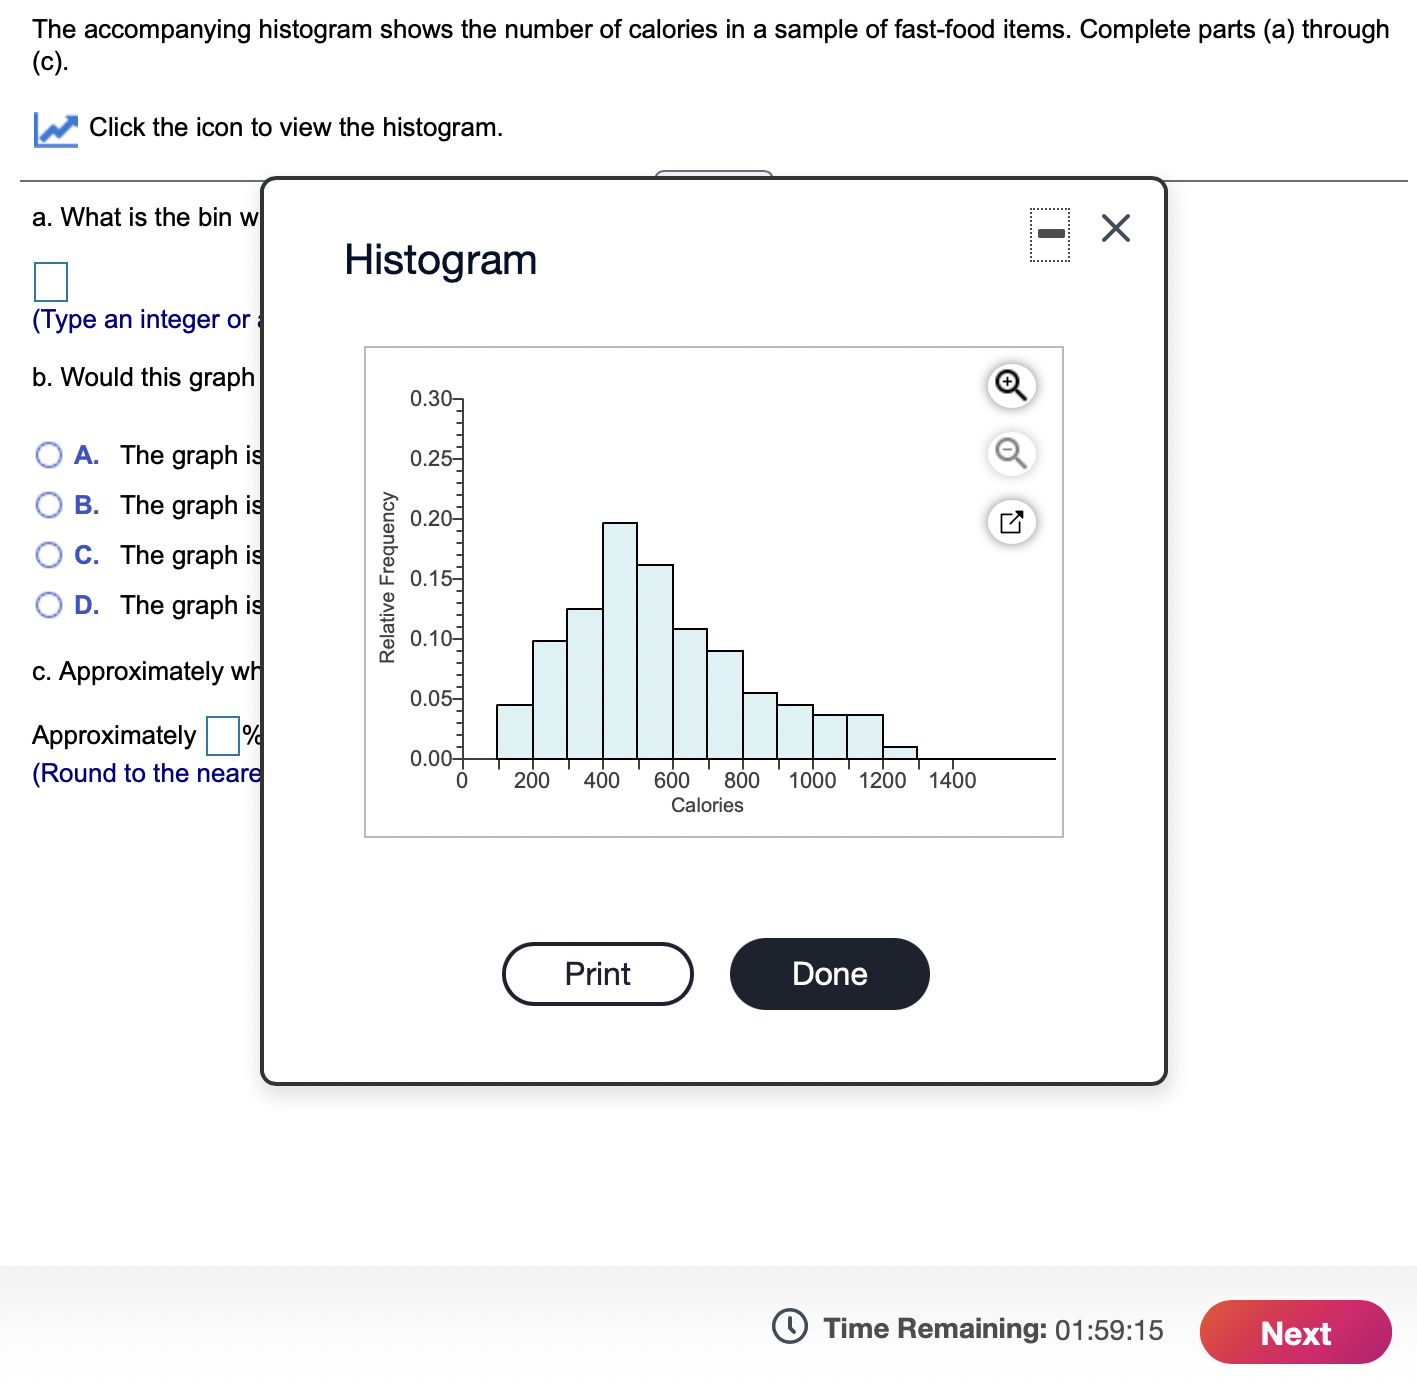
Question: A. What is the bin width of the histogram? Integer or decimal, don't round. b. Would this graph be best described as unimodal or?bimodal? A.
A. What is the bin width of the histogram?
Integer or decimal, don't round.
b. Would this graph be best described as unimodal or?bimodal?
A.
The graph is best described as bimodal because there aretwomodes.
B.
The graph is best described as unimodal because there isonemode.
C.
The graph is best described as bimodal because there aremultiplemodes.
D.
The graph is best described as unimodal because there aretwomodes.
c. Approximately what percentage of the?fast-food items contained fewer than 300?calories?
Approximately
nothing
?% of the?fast-food items contained fewer than 300 calories.
The accompanying histogram shows the number of calories in a sample of fast-food items. Complete parts (a) through (C)- [i Click the icon to view the histogram. D Histogram (Type an integer or b. Would this graph O A. The graph i O B. The graph i- O C. The graph i O D. The graph i Relative Frequency c. Approximately w Approximately |:| (Round to the near ' 600 800 1000 1200 1400 Calories C) Time Remaining: 01:59:15 m
Step by Step Solution
There are 3 Steps involved in it

Get step-by-step solutions from verified subject matter experts