

Question: a). What is the dependent variable in the table? The independent variable? b). Describe the nature of the relationship between the dependent and independent variables,
a). What is the dependent variable in the table? The independent variable?
b). Describe the nature of the relationship between the dependent and independent variables, using selected data from the table to support your claims.
c). Why do you think the relationship you describe is observed in the table?
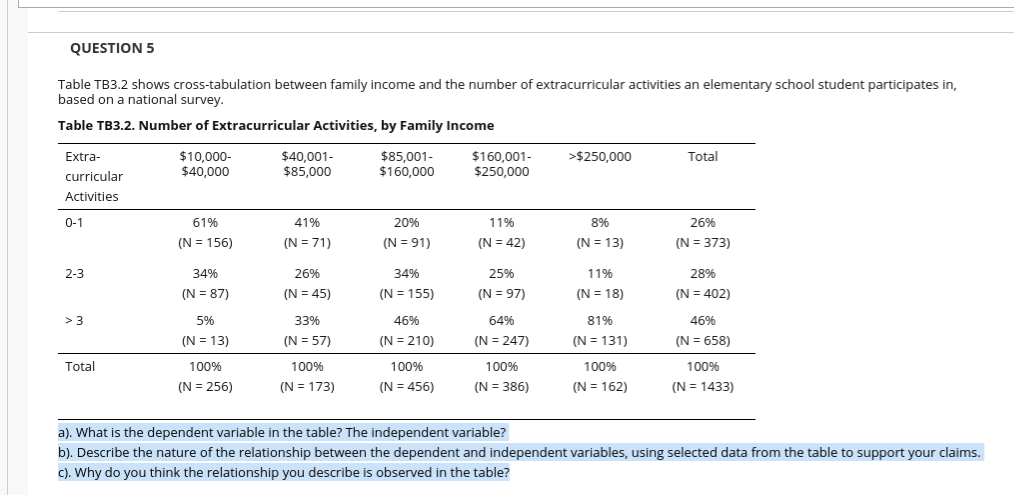
QUESTION 5 Table TB3.2 shows cross-tabulation between family income and the number of extracurricular activities an elementary school student participates in, based on a national survey. Table TB3.2. Number of Extracurricular Activities, by Family Income Extra- $10,000- $40,001- $85,001- $160,001- >$250,000 Total curricular $40,000 $85,000 $160,000 $250,000 Activities 0-1 61% 41% 20% 1 1% 8% 26% (N = 156) (N = 71) (N = 91) (N = 42) (N = 13) (N = 373) 2-3 34% 26% 34% 25% 1 1% 28% (N = 87) (N = 45) (N = 155) (N = 97) (N = 18) (N = 402) >3 5% 33% 46% 64% 81% 46% (N = 13) (N = 57) (N = 210) (N = 247) (N = 131) (N = 658) Total 100% 100% 100% 100% 100% 100% (N = 256) (N = 173) (N = 456) (N = 386) (N = 162) (N = 1433) a). What is the dependent variable in the table? The independent variable? b). Describe the nature of the relationship between the dependent and independent variables, using selected data from the table to support your claims. c). Why do you think the relationship you describe is observed in the table
Step by Step Solution
There are 3 Steps involved in it

Get step-by-step solutions from verified subject matter experts