

Question: a. What is the simple linear regression equation that can be used to predict a state's Percent of Children in families that receive public assistance
a. What is the simple linear regression equation that can be used to predict a state's Percent of Children in families that receive public assistance in 2019 based on the Percent of Fourth graders who are chronically absent from school in 2019? Do not copy the entire output. Just write the equation.
b. What is the slope of the regression equation (2 decimal places) and be sure to include a +/- sign?
(sorry the picture is so packed, I couldn't find a way to just attach the excel file.)
(if you need the actual file just comment your email and I can send it over.)
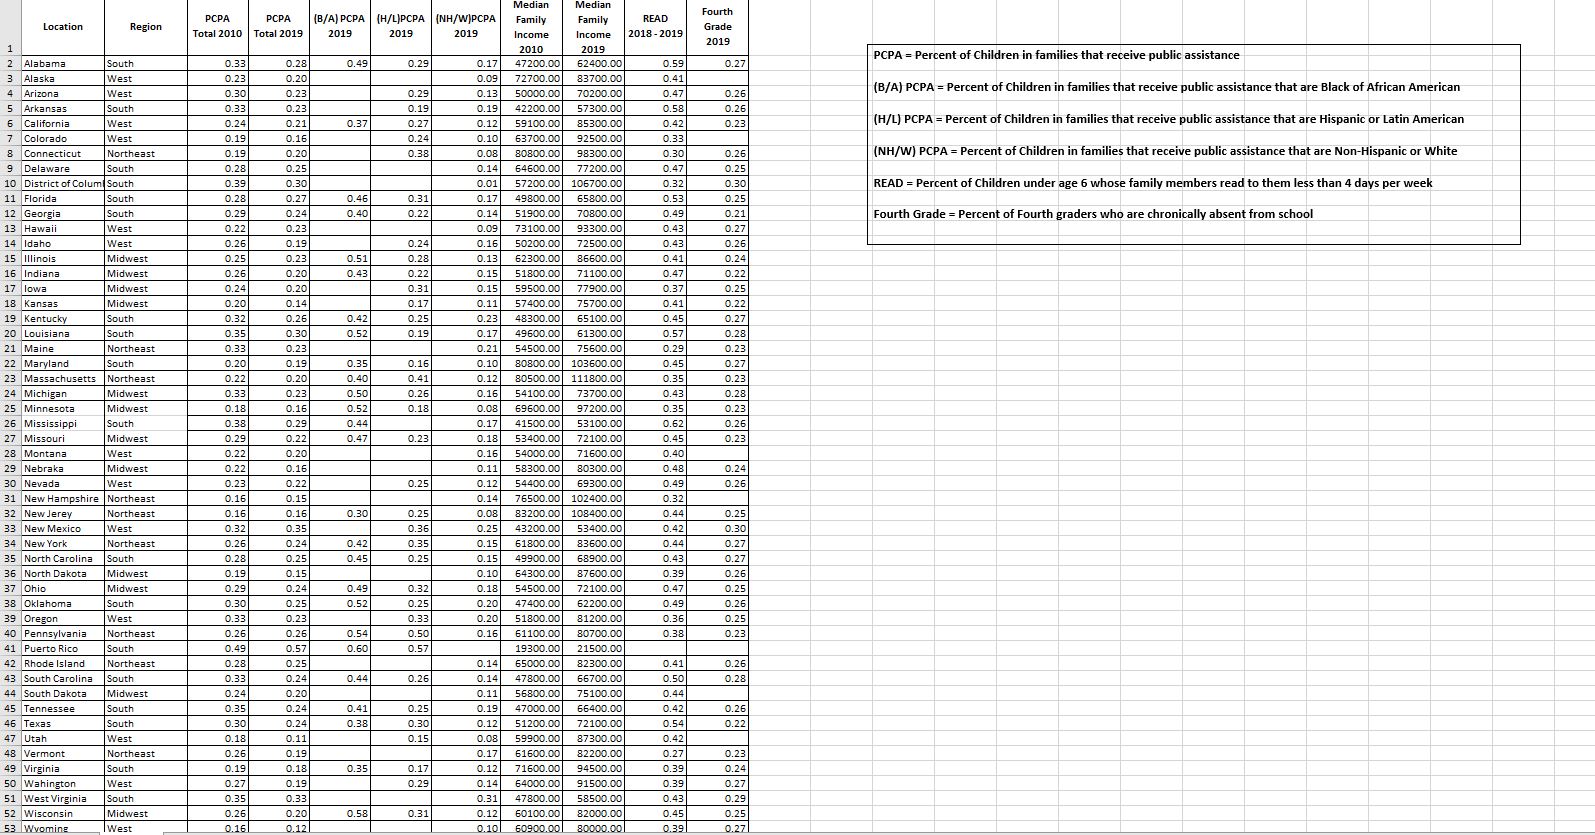
Median Median PCPA PCPA Region (B/A) PCPA (H/L)PCPA (NH/W)PCPA Family Family READ Fourth Location Total 2010 Total 2019 2019 2019 2019 Income Income 2018 -2019 Grade 1 2019 2010 2 Alabama 2019 South 0.33 0.28 0.49 0.29 0.17 47200.00 62400.00 3 0.59 0.27 PCPA = Percent of Children in families that receive public assistance Vest 0.23 0.20 0.09 72700.00 83700.00 0.41 4 Arizona West 0.30 0.23 0.29 0.13| 50000.00 70200.00 0.47 5 Arkansas 0.26 (B/A) PCPA = Percent of Children in families that receive public assistance that are Black of African American South 0.33 0.23 0.19 0.19 42200.00 57300.00 6 California 0.58 0.26 West 0.24 0.21 0.37 0.27 0.12 59100.00 85300.00 0.42 0.23 7 Colorado West 0.19 0.16 (H/L) PCPA = Percent of Children in families that receive public assistance that are Hispanic or Latin American 0.24 0.10 63700.00 92500.00 0.33 8 Connecticut Northeast 0.19/ 0.20 0.38 0.08 80800.00 98300.00 0.30 9 Delaware 0.26 South 0.28 0.25 (NH/W) PCPA = Percent of Children in families that receive public assistance that are Non-Hispanic or White 0.14 64600.00 77200.00 0.47 0.25 10 District of Colum South 0.39 0.30 0.01 57200.00 106700.00 0.32 0.30 11 Florida South 0.28 0.27 0.46 0.31 0.17 49800.00 65800.00 READ = Percent of Children under age 6 whose family members read to them less than 4 days per week 0.53 0.25 12 Georgia South 0.29 0.24 0.40 0.22 51900.00 70800.00 0.49 13 Hawaii 0.21 West 0.22 0.23 0.09 73100.00 93300.00 0.43 Fourth Grade = Percent of Fourth graders who are chronically absent from school 14 Idaho Vest 0.27 0.26 0.19 0.24 0.16 50200.00 72500.00 0.43 15 Illinois 0.26 Midwest 0.25 0.23 0.51 0.28 0.13 62300.00 16 Indiana 86600.00 0.41 Midwest 0.24 0.26 0.20 0.43 0.22 0.15 51800.00 71100.00 0.47 17 lowa Midwest 0.24 0.20 0.22 0.31 0.15 59500.00 77900.00 0.37 0.25 18 Kansas Midwest 0.20 0.14 0.17 0.11 57400.00 75700.00 0.41 0.22 19 Kentucky South 0.32 0.26 0.42 0.25 0.23 48300.00 65100.00 0.45 0.27 20 Louisiana South 0.35 0.30 0.52 0.19 0.17 49600.00 61300.00 0.57 21 Maine 0.33 0.28 Northeast 0.23 0.21 54500.00 75600.00 0.29 22 Maryland 0.20 0.23 South 0.19 0.35 0.16 0.10 80800.00 103600.00 0.45 0.27 23 Mas sachusetts Northeast 0.22 0.20 0.40 0.41 0.12 80500.00 111800.00 0.35 24 Michigan 0.33 0.23 Midwest 0.23 0.50 0.26 0.16 54100.00 73700.00 0.43 0.28 25 Minnesota Midwest 0.18 0.16 0.52 0.18 0.08 69600.00 97200.00 0.35 0.23 26 Mississippi out 0.38 0.29 0.44 0.17 41500.00 53100.00 0.62 Midwest 0.26 27 Missour 0.29 0.22 0.47 0.23 0.18 53400.00 72100.00 0.45 0.23 28 Montana West 0.22 0.20 0.16 54000.00 71600.00 0.40 29 Nebrake Midwest 0.22 0.16 0.11 58300.00 80300.00 0.48 30 Nevada 0.24 West 0.23 0.22 0.25 54400.00 69300.00 0.49 0.26 31 New Hampshire |Northeast 0.16 0.15 76500.00 102400.00 0.32 32 New Jere Northeast 0.16 0.16 0.30 0.25 83200.00 108400.00 0.44 33 New Mexico 0.25 West 0.32 0.35 0.36 0.25 43200.00 53400.00 0.42 0.30 34 New York Northeast 0.26 0.24 0.42 0.35 0.15 61800.00 83600.00 0.44 35 North Carolina South 0.28 0.25 0.27 0.45 0.25 0.15 49900.00 68900.00 0.43 36 North Dakota 0.27 Midwest 0.19 0.15 0.10 64300.00 87600.00 0.39 37 Ohio 0.26 Midwest 0.29 0.24 0.49 0.32 54500.00 72100.00 0.47 38 Oklahoma 0.25 South 0.30 0.25 0.52 0.25 0.20 47400.00 62200.00 0.49 D.26 39 Oregon West 0.33 0.23 0.33 0.20 51800.00 81200.00 0.36 0.25 40 Pennsylvania Northeast 0.26 0.26 0.54 0.50 0.16 61100.00 80700.00 0.38 0.23 41 Puerto Rico South 0.49 0.57 0.60 0.57 19300.00 21500.00 42 Rhode Island Northeast 0.28 0.25 0.14 65000.00 82300.00 0.41 43 South Carolina 0.26 |South 0.33 0.24 0.44 0.26 0.14 47800.00 66700.00 0.50 0.28 44 South Dakota Midwest 0.24 0.20 0.11 56800.00 75100.00 0.44 45 Tennessee South 0.35 0.24 0.41 0.25 0.19 47000.00 66400.00 0.42 46 Texas South 0.30 0.24 0.38 0.26 0.30 0.12 51200.00 72100.00 0.54 0.22 47 Utah West 0.18 0.11 0.15 0.08 59900.00 87300.00 0.42 48 Vermont Northeast 0.26 0.19 0.17 61600.00 82200.00 0.27 0.23 49 Virginia South 0.19 0.18 0.35 0.17 0.12 71600.00 94500.00 0.39 0.24 50 Wahington West 0.27 0.19 0.29 64000.00 91500.00 0.39 51 West Virginia 0.27 South 0.35 0.33 0.31 47800.00 58500.00 0.43 0.29 52 Wisconsin Midwest 0.26 0.20 0.58 0.31 0.12 53 60100.00 82000.00 0.45 0.25 West 0.16 0.12 2.10 60900.00 80000.00 D.39 D.27
Step by Step Solution
There are 3 Steps involved in it

Get step-by-step solutions from verified subject matter experts