

Question: A WS student was interested in analyzing the time it take the cue bus to complete her commute from the Vienna Metro to WS. She
A WS student was interested in analyzing the time it take the cue bus to complete her commute from the Vienna Metro to WS. She collected data for 600 trips she took during her tenure at WS.
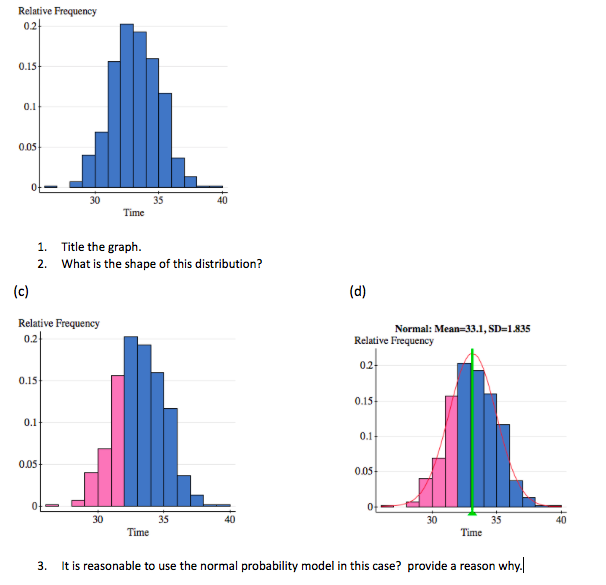
Relative Frequency 0.2 0.15 0.1 0.05 30 35 Time 1. Title the graph. 2. What is the shape of this distribution? (c) (d) Relative Frequency 0.2 Normal: Mean=33.1, SD=1.835 Relative Frequency 0.15 0.2 0.15- 0.1 0.1 0.05. 0.05 30 35 Time 30 35 Time 3. It is reasonable to use the normal probability model in this case? provide a reason why.|
Step by Step Solution
There are 3 Steps involved in it
1 Expert Approved Answer
Step: 1 Unlock

Question Has Been Solved by an Expert!
Get step-by-step solutions from verified subject matter experts
Step: 2 Unlock
Step: 3 Unlock