

Question: a) You expect Flight Centre Ltd. to maintain the same dividend payout ratio as at 30th June 2017 for the next three years. After three
a) You expect Flight Centre Ltd. to maintain the same dividend payout ratio as at 30th June 2017 for the next three years. After three years, the company will increase the dividend payout ratio to 70%. Assume companys return on new investment is 16.6% and the required rate of return is 10%. Using the dividend discount model, calculate the intrinsic value for stock today.
b) Based on your answer in Part(a), would you recommend to buy, sell or hold the stock? Give the recommendation and briefly discuss the difference between the intrinsic value and stock price. (no more than 200 words)
All financial statement numbers are in millions of dollars unless otherwise indicated
Assume today is 30th June 2017 and you have just been paid a dividend and that the next dividend will be received in exactly one year (assume dividend is paid annually).
The stock price as at 30th June 2017 was $38.30.
Use this spreadsheet if necessary
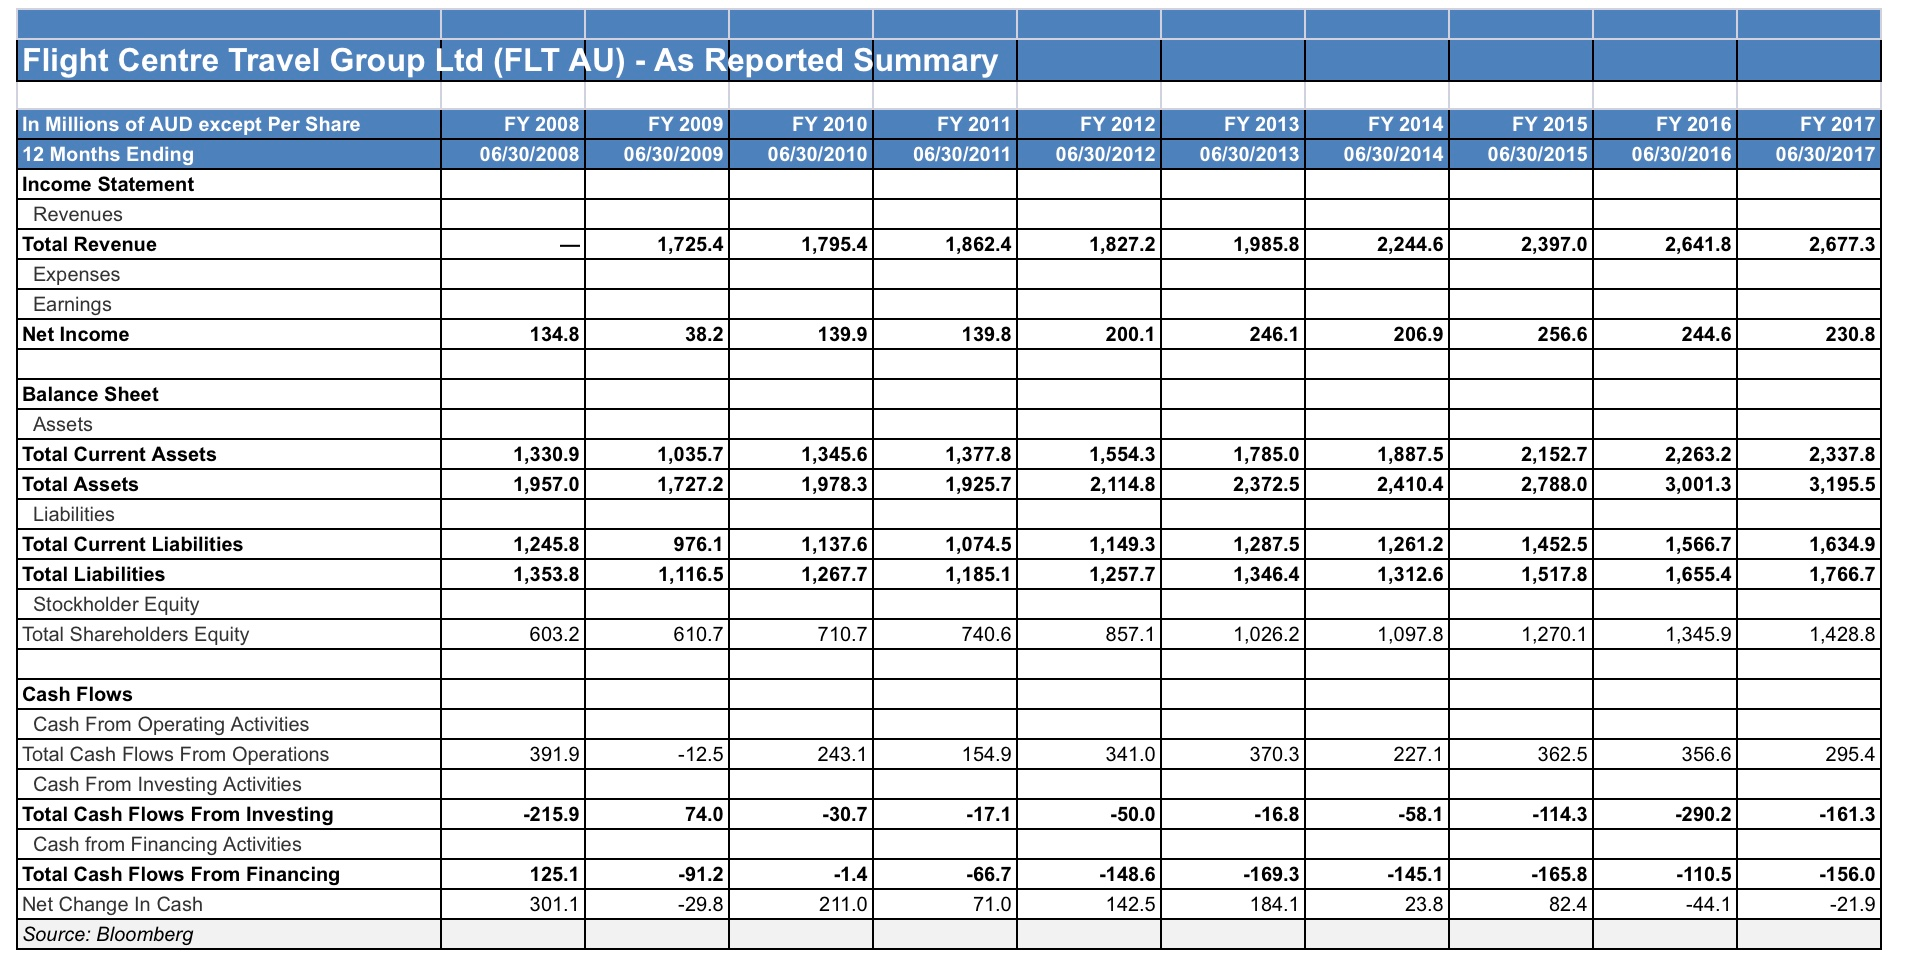
Flight Centre Travel Group Ltd (FLT AU) - As Reported Summary FY 2015 FY 2008 06/30/2008 FY 2009 06/30/2009 FY 2010 06/30/2010 FY 2011 06/30/2011 FY 2012 06/30/2012 FY 2013 06/30/2013 FY 2014 06/30/2014 FY 2016 06/30/2016 FY 2017 06/30/2017 06/30/2015 In Millions of AUD except Per Share 12 Months Ending Income Statement Revenues Total Revenue Expenses Earnings Net Income 1,725.4 1,795.4 1,862.4 1,827.2 1,985.8 2,244.6 2,397.0 2,641.8 2,677.3 134.8 38.2 139.9 139.8 200.1 246.1 206.9 256.6 244.6 230.8 1,330.9 1,957.0 1,035.7 1,727.2 1,345.6 1,978.3 1,377.8 1,925.7 1,554.3 2,114.8 1,785.0 2,372.5 1,887.5 2,410.4 2,152.7 2,788.0 2,263.2 3,001.3 2,337.8 3,195.5 Balance Sheet Assets Total Current Assets Total Assets Liabilities Total Current Liabilities Total Liabilities Stockholder Equity Total Shareholders Equity 1,245.8 1,353.8 976.1 1,116.5 1,137.6 1,267.7 1,074.5 1,185.1 1,149.3 1,257.7 1,287.5 1,346.4 1,261.2 1,312.6 1,452.5 1,517.8 1,566.7 1,655.4 1,634.9 1,766.7 603.2 610.7 710.7 740.6 857.1 1,026.2 1,097.8 1,270.1 1,345.9 1,428.8 391.9 - 12.5 243.1 154.9 341.0 370.3 227.1 362.5 356.6 295.4 Cash Flows Cash From Operating Activities Total Cash Flows From Operations Cash From Investing Activities Total Cash Flows From Investing Cash from Financing Activities Total Cash Flows From Financing Net Change In Cash Source: Bloomberg -215.9 74.0 -30.7 -17.1 -50.0 -16.8 -58.1 -114.3 -290.2 -161.3 -1.4 -66.7 125.1 301.1 -91.2 -29.8 -148.6 142.5 -169.3 184.1 -145.1 23.8 -165.8 82.4 -110.5 -44.1 -156.0 -21.9 211.0 71.0 Flight Centre Travel Group Ltd (FLT AU) - As Reported Summary FY 2015 FY 2008 06/30/2008 FY 2009 06/30/2009 FY 2010 06/30/2010 FY 2011 06/30/2011 FY 2012 06/30/2012 FY 2013 06/30/2013 FY 2014 06/30/2014 FY 2016 06/30/2016 FY 2017 06/30/2017 06/30/2015 In Millions of AUD except Per Share 12 Months Ending Income Statement Revenues Total Revenue Expenses Earnings Net Income 1,725.4 1,795.4 1,862.4 1,827.2 1,985.8 2,244.6 2,397.0 2,641.8 2,677.3 134.8 38.2 139.9 139.8 200.1 246.1 206.9 256.6 244.6 230.8 1,330.9 1,957.0 1,035.7 1,727.2 1,345.6 1,978.3 1,377.8 1,925.7 1,554.3 2,114.8 1,785.0 2,372.5 1,887.5 2,410.4 2,152.7 2,788.0 2,263.2 3,001.3 2,337.8 3,195.5 Balance Sheet Assets Total Current Assets Total Assets Liabilities Total Current Liabilities Total Liabilities Stockholder Equity Total Shareholders Equity 1,245.8 1,353.8 976.1 1,116.5 1,137.6 1,267.7 1,074.5 1,185.1 1,149.3 1,257.7 1,287.5 1,346.4 1,261.2 1,312.6 1,452.5 1,517.8 1,566.7 1,655.4 1,634.9 1,766.7 603.2 610.7 710.7 740.6 857.1 1,026.2 1,097.8 1,270.1 1,345.9 1,428.8 391.9 - 12.5 243.1 154.9 341.0 370.3 227.1 362.5 356.6 295.4 Cash Flows Cash From Operating Activities Total Cash Flows From Operations Cash From Investing Activities Total Cash Flows From Investing Cash from Financing Activities Total Cash Flows From Financing Net Change In Cash Source: Bloomberg -215.9 74.0 -30.7 -17.1 -50.0 -16.8 -58.1 -114.3 -290.2 -161.3 -1.4 -66.7 125.1 301.1 -91.2 -29.8 -148.6 142.5 -169.3 184.1 -145.1 23.8 -165.8 82.4 -110.5 -44.1 -156.0 -21.9 211.0 71.0
Step by Step Solution
There are 3 Steps involved in it

Get step-by-step solutions from verified subject matter experts