

Question: A1 fx A D E F G . K L M N 0 Q R B JHWI 104.63 1 2 3 U 5.63 5.46 5.63
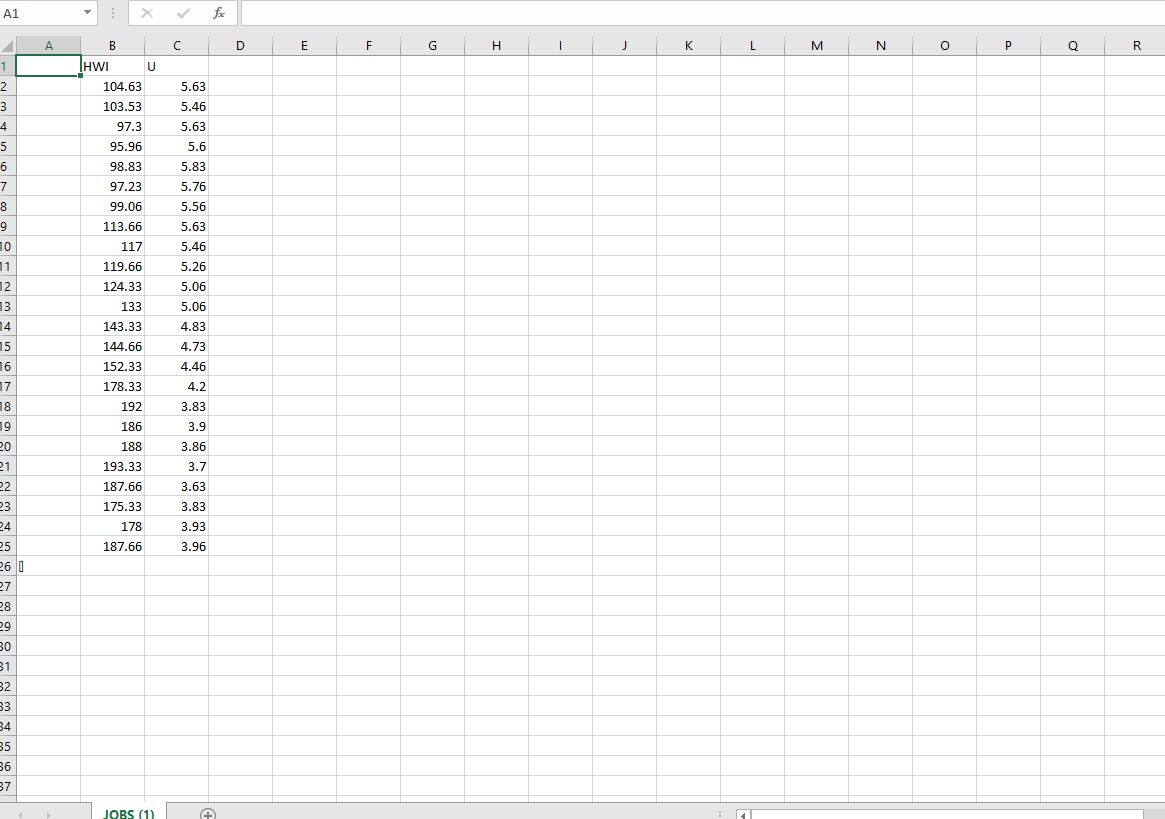

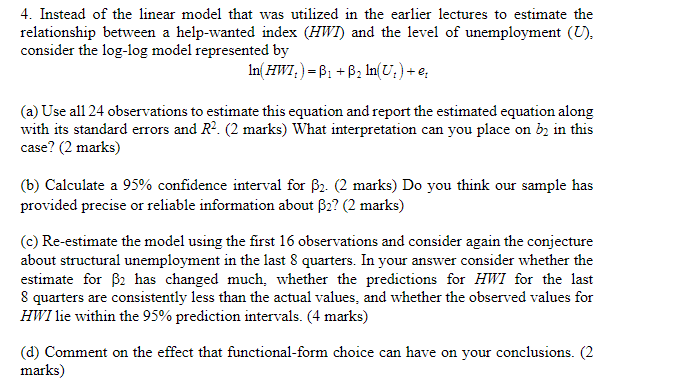
A1 fx A D E F G . K L M N 0 Q R B JHWI 104.63 1 2 3 U 5.63 5.46 5.63 4 5 5.6 103.53 97.3 95.96 98.83 97.23 99.06 6 7 8 9 10 11 12 13 14 113.66 117 119.66 124.33 133 143.33 144.66 152.33 178.33 192 186 5.83 5.76 5.56 5.63 5.46 5.26 5.06 5.06 4.83 4.73 4.46 4.2 3.83 3.9 188 3.86 3.7 3.63 193.33 187.66 175.33 178 187.66 3.83 3.93 3.96 15 16 17 18 19 20 21 22 23 24 25 26 0 27 28 29 30 31 32 33 34 35 36 37 JOBS (1) + Aunt 02 SALARY e Search Oiratian Song Fle Home Insert Page Layout Formulas Review View Help Power Pivot Share Comments A1 > H K L M N P R S T v w X Y 2 AN AR AC T 1 0 1 ly 2 3 4 S G 7 Ix 3900 4020 4290 4380 44 5 5 E 12 10 12 & & 8 12 12 1 1 7 30 7 0 7 10 4.11n 4380 7.5 0 0 0 8 9 12 15 D 2 10 4.5 75 32 440 4300 4500 4620 4900 8 12 12 3 19 52 11 12 13 14 15 16 17 18 19 20 21 70 5 11 4900 4900 11 4900 8 12 12 12 12 12 12 13 12 16 & 4900 4900 4900 144 103 12R 281 214 318 96 20 23 12 17 22 24 12 26 1 15 25 33 15 14 1 1 4 23 24 4980 36 26 27 28 70 8 12 12 15 15 16 12 59 115 165 123 & 12 32 33 34 35 20 5100 5100 5100 5200 5100 5100 51001 5220 5220 5280 5280 5290 5100 5400 5400 5400 5400 5400 5400 12 12 29 29 11 37 18 102 127 10 190 107 173 228 26 26 38 82 169 8 8 12 R 8 12 12 12 12 12 SALARY 29 40 41 1 11 34 33 11 33 22 29 27 12 43 . Ready 4. Instead of the linear model that was utilized in the earlier lectures to estimate the relationship between a help-wanted index (HWT) and the level of unemployment (U). consider the log-log model represented by In HWI)=B1 +B, In(U)+e, (a) Use all 24 observations to estimate this equation and report the estimated equation along with its standard errors and R2. (2 marks) What interpretation can you place on b2 in this case? (2 marks) (b) Calculate a 95% confidence interval for B2. (2 marks) Do you think our sample has provided precise or reliable information about B2? (2 marks) (c) Re-estimate the model using the first 16 observations and consider again the conjecture about structural unemployment in the last 8 quarters. In your answer consider whether the estimate for B2 has changed much, whether the predictions for HWI for the last 8 quarters are consistently less than the actual values, and whether the observed values for HWI lie within the 95% prediction intervals. (4 marks) (d) Comment on the effect that functional-form choice can have on your conclusions. (2 marks) A1 fx A D E F G . K L M N 0 Q R B JHWI 104.63 1 2 3 U 5.63 5.46 5.63 4 5 5.6 103.53 97.3 95.96 98.83 97.23 99.06 6 7 8 9 10 11 12 13 14 113.66 117 119.66 124.33 133 143.33 144.66 152.33 178.33 192 186 5.83 5.76 5.56 5.63 5.46 5.26 5.06 5.06 4.83 4.73 4.46 4.2 3.83 3.9 188 3.86 3.7 3.63 193.33 187.66 175.33 178 187.66 3.83 3.93 3.96 15 16 17 18 19 20 21 22 23 24 25 26 0 27 28 29 30 31 32 33 34 35 36 37 JOBS (1) + Aunt 02 SALARY e Search Oiratian Song Fle Home Insert Page Layout Formulas Review View Help Power Pivot Share Comments A1 > H K L M N P R S T v w X Y 2 AN AR AC T 1 0 1 ly 2 3 4 S G 7 Ix 3900 4020 4290 4380 44 5 5 E 12 10 12 & & 8 12 12 1 1 7 30 7 0 7 10 4.11n 4380 7.5 0 0 0 8 9 12 15 D 2 10 4.5 75 32 440 4300 4500 4620 4900 8 12 12 3 19 52 11 12 13 14 15 16 17 18 19 20 21 70 5 11 4900 4900 11 4900 8 12 12 12 12 12 12 13 12 16 & 4900 4900 4900 144 103 12R 281 214 318 96 20 23 12 17 22 24 12 26 1 15 25 33 15 14 1 1 4 23 24 4980 36 26 27 28 70 8 12 12 15 15 16 12 59 115 165 123 & 12 32 33 34 35 20 5100 5100 5100 5200 5100 5100 51001 5220 5220 5280 5280 5290 5100 5400 5400 5400 5400 5400 5400 12 12 29 29 11 37 18 102 127 10 190 107 173 228 26 26 38 82 169 8 8 12 R 8 12 12 12 12 12 SALARY 29 40 41 1 11 34 33 11 33 22 29 27 12 43 . Ready 4. Instead of the linear model that was utilized in the earlier lectures to estimate the relationship between a help-wanted index (HWT) and the level of unemployment (U). consider the log-log model represented by In HWI)=B1 +B, In(U)+e, (a) Use all 24 observations to estimate this equation and report the estimated equation along with its standard errors and R2. (2 marks) What interpretation can you place on b2 in this case? (2 marks) (b) Calculate a 95% confidence interval for B2. (2 marks) Do you think our sample has provided precise or reliable information about B2? (2 marks) (c) Re-estimate the model using the first 16 observations and consider again the conjecture about structural unemployment in the last 8 quarters. In your answer consider whether the estimate for B2 has changed much, whether the predictions for HWI for the last 8 quarters are consistently less than the actual values, and whether the observed values for HWI lie within the 95% prediction intervals. (4 marks) (d) Comment on the effect that functional-form choice can have on your conclusions. (2 marks)
Step by Step Solution
There are 3 Steps involved in it

Get step-by-step solutions from verified subject matter experts