

Question: A1 fx Site ID A B C D E F Site ID Attachment Area (ha) Butterfly Species Bird Species Plant Species 2 A 4.4 23.8

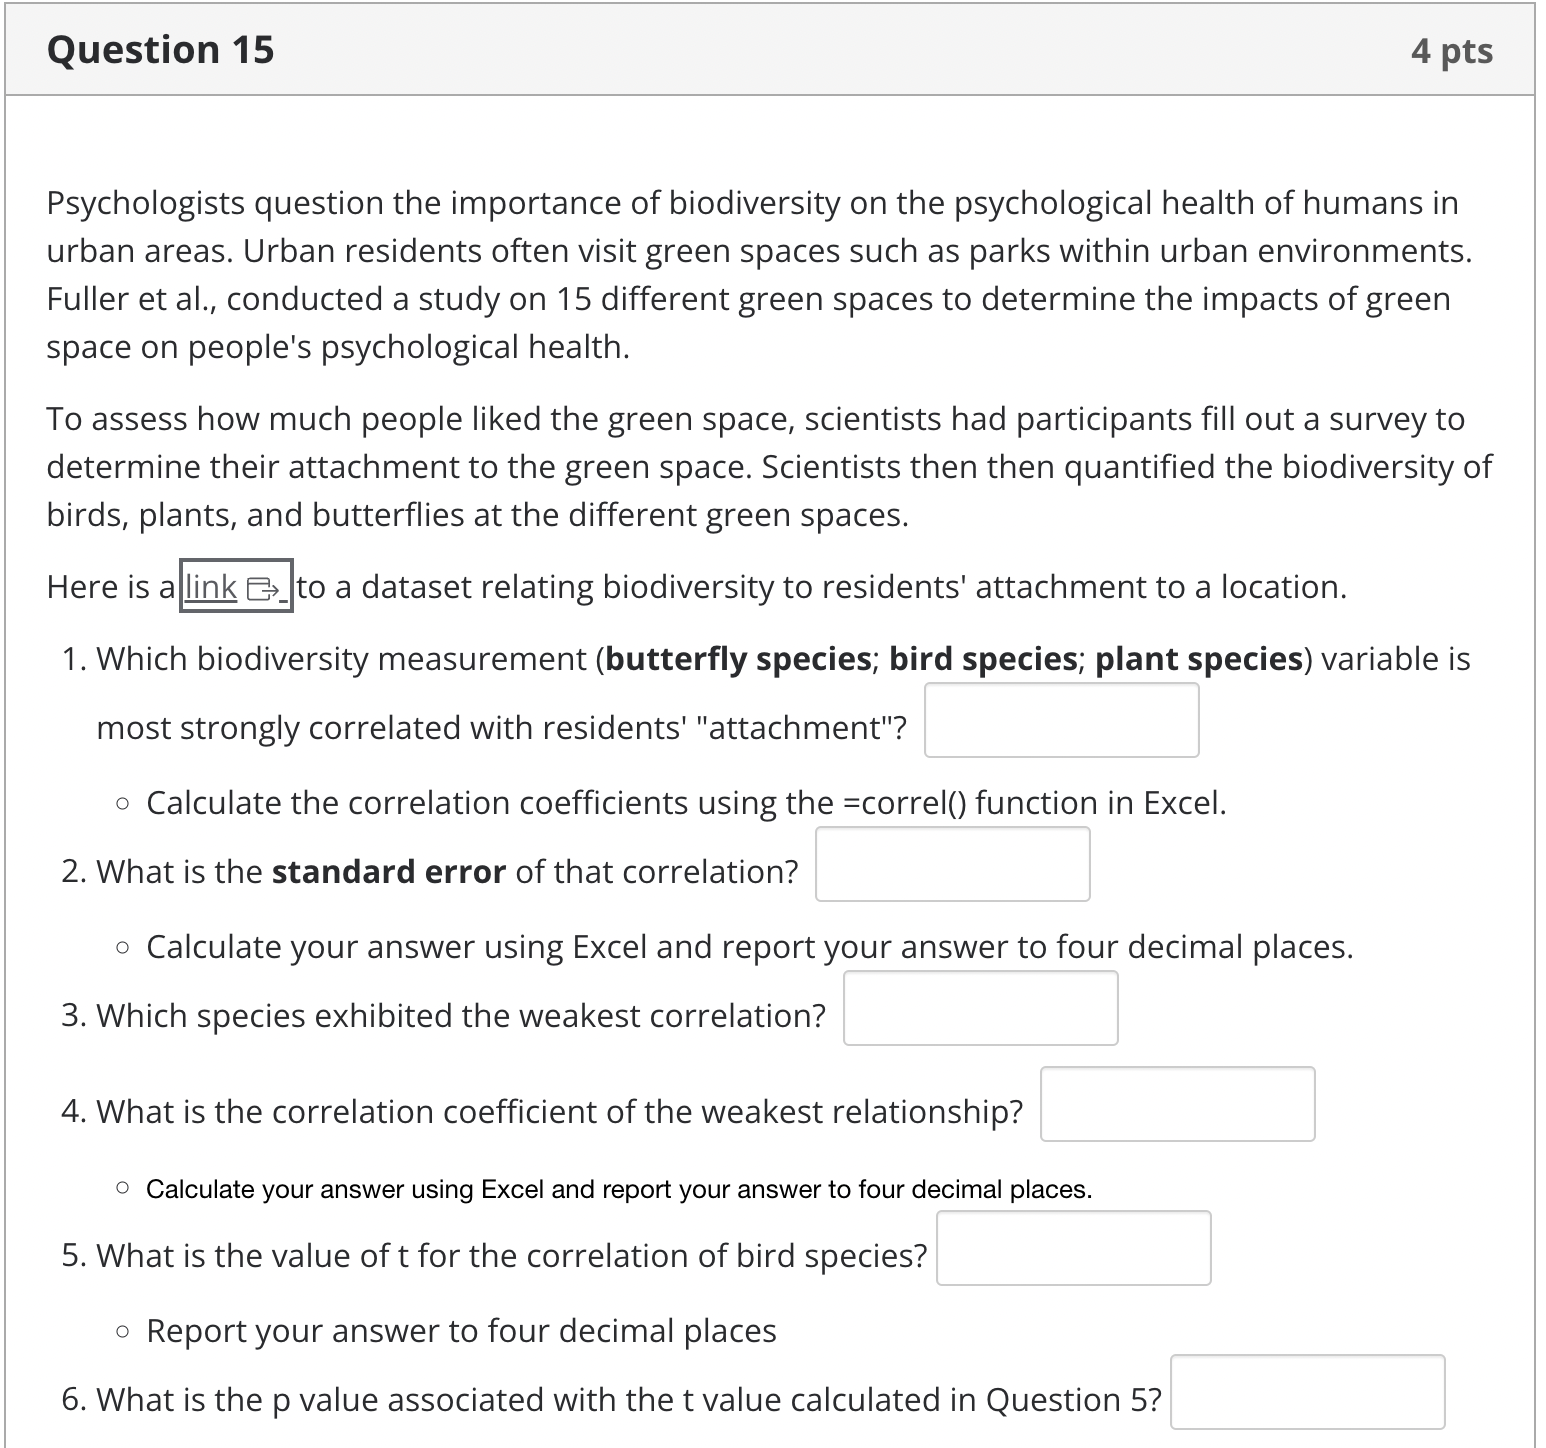

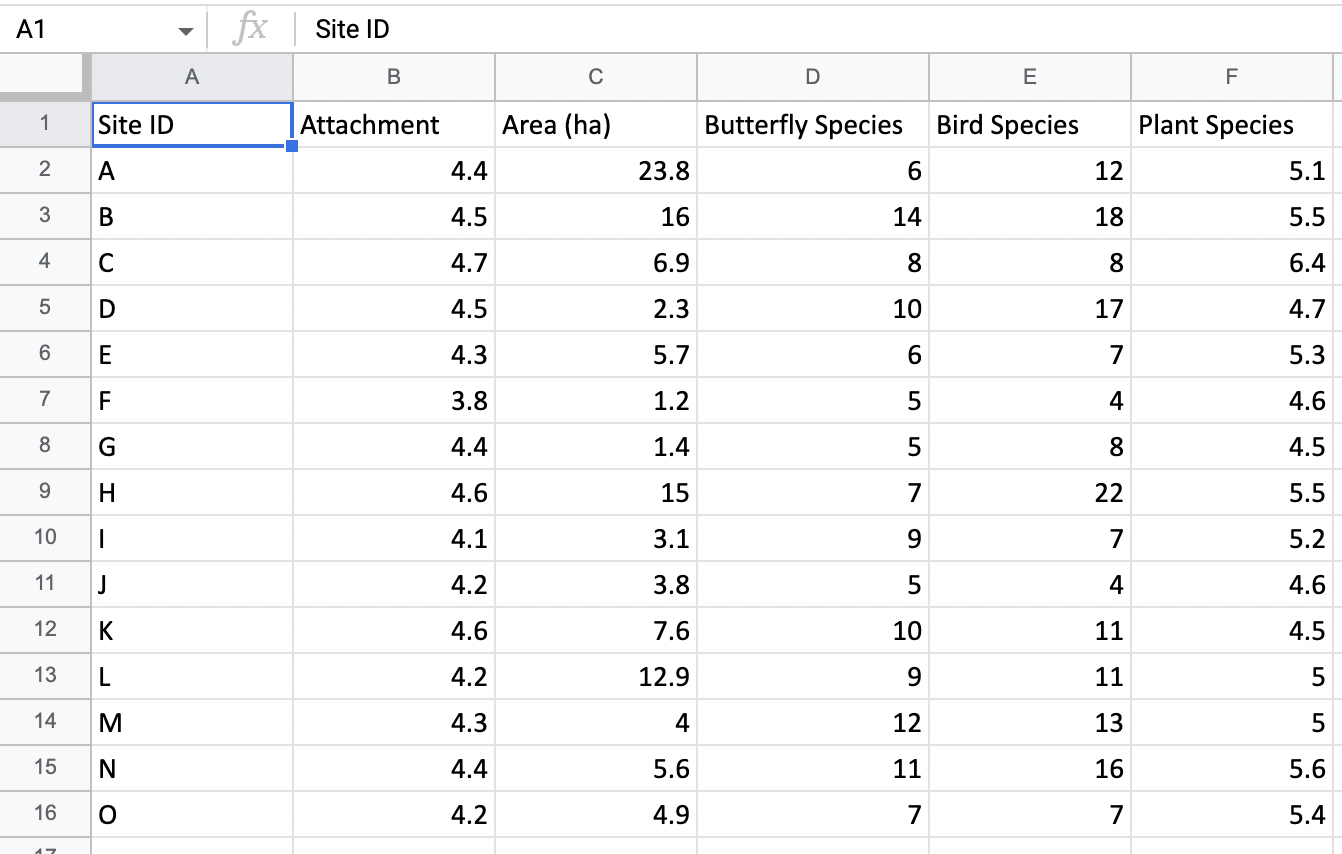

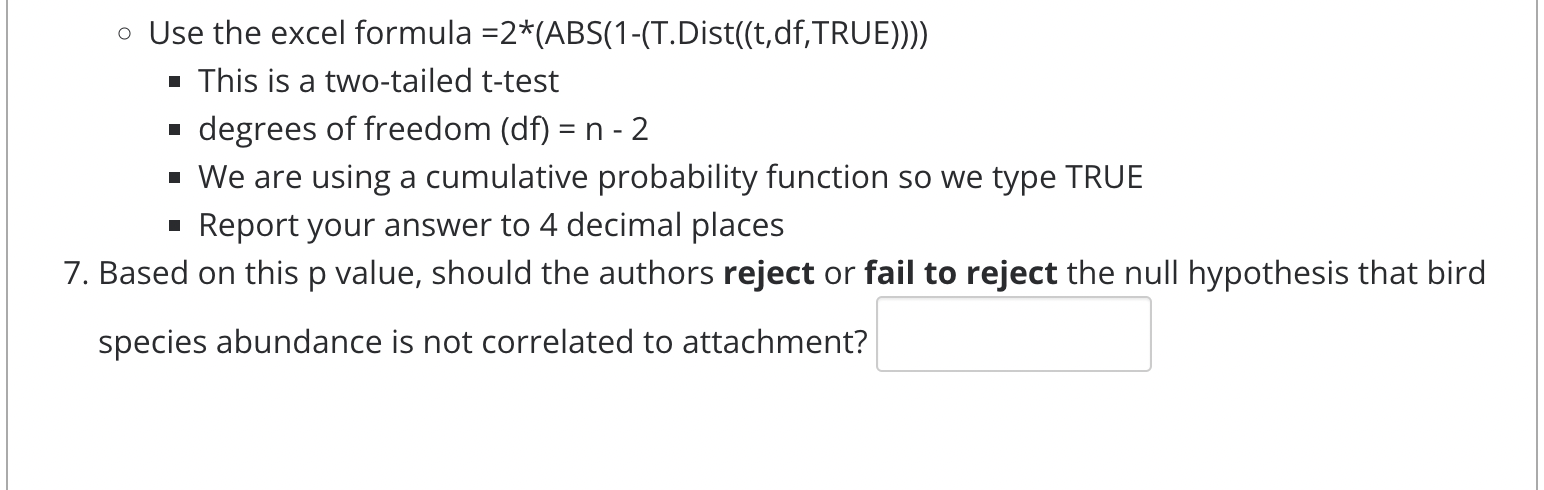
A1 fx Site ID A B C D E F Site ID Attachment Area (ha) Butterfly Species Bird Species Plant Species 2 A 4.4 23.8 6 12 5.1 3 B 4.5 16 14 18 5.5 4 C 4.7 6.9 8 8 6.4 5 D 4.5 2.3 10 17 4.7 6 m 4.3 5.7 6 7 5.3 7 F 3.8 1.2 5 4 4.6 8 G 4.4 1.4 5 8 4.5 9 H 4.6 15 22 5.5 10 4.1 3.1 9 7 5.2 11 L 4.2 3.8 5 4 4.6 12 K 4.6 7.6 10 11 4.5 13 L 4.2 12.9 9 11 5 14 M 4.3 4 12 13 5 15 N 4.4 5.6 11 16 5.6 16 O 4.2 4.9 7 7 5.4Question 15 4 pts Psychologists question the importance of biodiversity on the psychological health of humans in urban areas. Urban residents often visit green spaces such as parks within urban environments. Fuller et al., conducted a study on 15 different green spaces to determine the impacts ofgreen space on people's psychological health. To assess how much people liked the green space, scientists had participants fill out a survey to determine their attachment to the green space. Scientists then then quantified the biodiversity of birds, plants, and butterflies at the different green spaces. Here is a -to a dataset relating biodiversity to residents' attachment to a location. 1. Which biodiversity measurement (butterfly species; bird species; plant species) variable is most strongly correlated with residents attachment"? 0 Calculate the correlation coefficients using the =corre|() function in Excel. 2. What is the standard error of that correlation? 0 Calculate your answer using Excel and report your answer to four decimal places. 3. Which species exhibited the weakest correlation? 4. What is the correlation coefficient of the weakest relationship? 0 Calculate your answer using Excel and report your answer to four decimal places. 5. What is the value oft for the correlation of bird species? 0 Report your answer to four decimal places 6. What is the p value associated with the t value calculated in Question 5? 0 Use the excel formula =2*(ABS('I-(T.Dist((t,df,TRUE)))) I This is a two-tailed t-test I degrees of freedom (df) = n - 2 I We are using a cumulative probability function so we type TRUE I Report your answer to 4 decimal places 7. Based on this p value, should the authors reject or fail to reject the null hypothesis that bird species abundance is not correlated to attachment
Step by Step Solution
There are 3 Steps involved in it

Get step-by-step solutions from verified subject matter experts