

Question: A time-series plot often helps you determine the appropriate model to use. For this problem, use each of the time series presented in the following

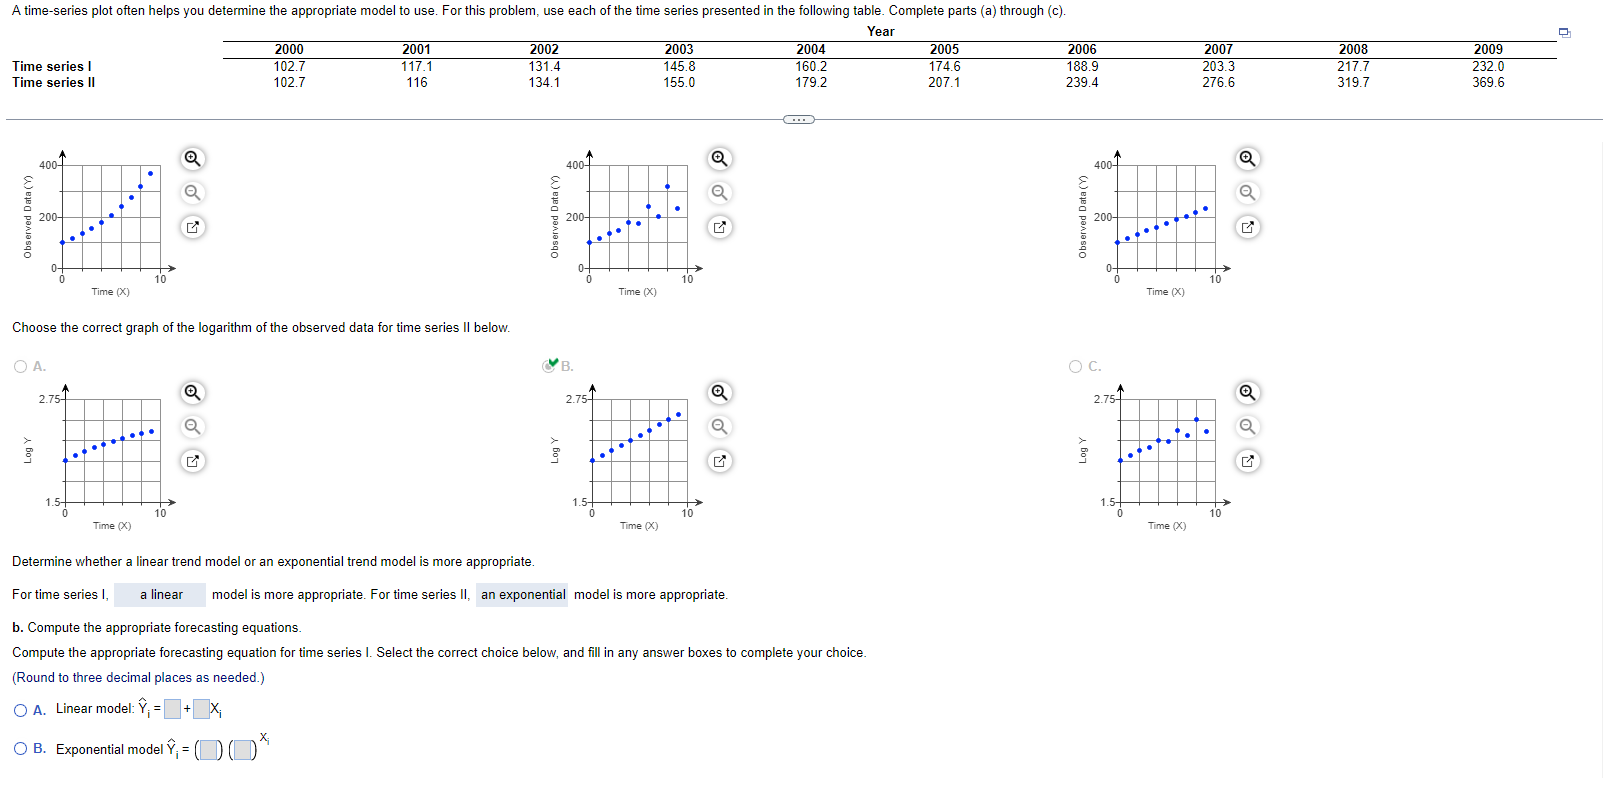
A time-series plot often helps you determine the appropriate model to use. For this problem, use each of the time series presented in the following table. Complete parts (a) through (c). Year 2000 2001 2002 2003 2004 2005 2006 2007 2008 2009 Time series I 102.7 117.1 131.4 145.8 160.2 174.6 188.9 203.3 217.7 232.0 Time series II 102.7 116 134.1 155.0 179.2 207.1 239.4 276.6 319.7 369.6 400- 400- 400- Observed Data (Y) 200 Observed Data (Y) Observed Data (Y) 200- 200 0- 10 0 10 Time (X) Time (X) Time (X) Choose the correct graph of the logarithm of the observed data for time series II below. O A. B. O C. 2.75 2.75 1 2.75 1 & Log Y Log Y Log Y 1.5- 1.5 10 10 Time (X) Time (X) Time (X) Determine whether a linear trend model or an exponential trend model is more appropriate. For time series I, a linear model is more appropriate. For time series II, an exponential model is more appropriate. b. Compute the appropriate forecasting equations. Compute the appropriate forecasting equation for time series I. Select the correct choice below, and fill in any answer boxes to complete your choice. (Round to three decimal places as needed.) O A. Linear model: Y, =+X; O B. Exponential model Y, = ( D) ( ))
Step by Step Solution
There are 3 Steps involved in it

Get step-by-step solutions from verified subject matter experts