

Question: #A-1 LOAD DATA SET: & display the first 6 records #A-2 EXPLORE the DATA SET: List the names of the 4 variables then display the
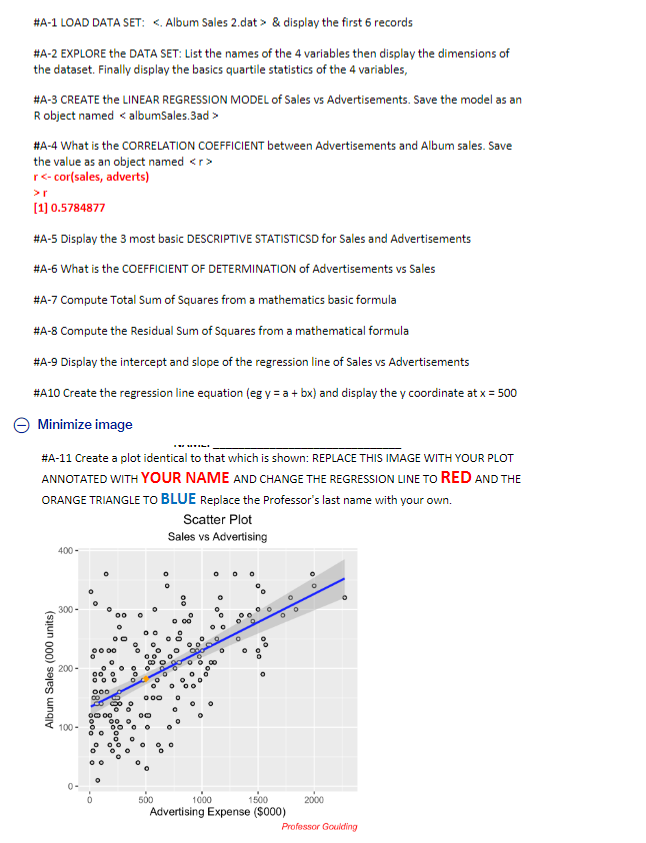
#A-1 LOAD DATA SET: <. album sales> & display the first 6 records #A-2 EXPLORE the DATA SET: List the names of the 4 variables then display the dimensions of the dataset. Finally display the basics quartile statistics of the 4 variables, #A-3 CREATE the LINEAR REGRESSION MODEL of Sales vs Advertisements. Save the model as an R object named #A-4 What is the CORRELATION COEFFICIENT between Advertisements and Album sales. Save the value as an object named r r [1] 0.5784877 #A-5 Display the 3 most basic DESCRIPTIVE STATISTICSD for Sales and Advertisements #A-6 What is the COEFFICIENT OF DETERMINATION of Advertisements vs Sales #A-7 Compute Total Sum of Squares from a mathematics basic formula #A-8 Compute the Residual Sum of Squares from a mathematical formula #A-9 Display the intercept and slope of the regression line of Sales vs Advertisements #A10 Create the regression line equation (eg y = a + bx) and display the y coordinate at x = 500 Minimize image #A-11 Create a plot identical to that which is shown: REPLACE THIS IMAGE WITH YOUR PLOT ANNOTATED WITH YOUR NAME AND CHANGE THE REGRESSION LINE TO RED AND THE ORANGE TRIANGLE TO BLUE Replace the Professor's last name with your own. Scatter Plot Sales vs Advertising 400- 300 - Album Sales (000 units) 200 DO 100 500 1000 1500 2000 Advertising Expense ($000) Professor Goulding
Step by Step Solution
There are 3 Steps involved in it

Get step-by-step solutions from verified subject matter experts