

Question: a=3 1. (30 points) x(t) = a + = a +cos(wet + 3) + 2a cos(3wot) + cos(5wot) a) (10 points) Find the exponential Fourier
a=3
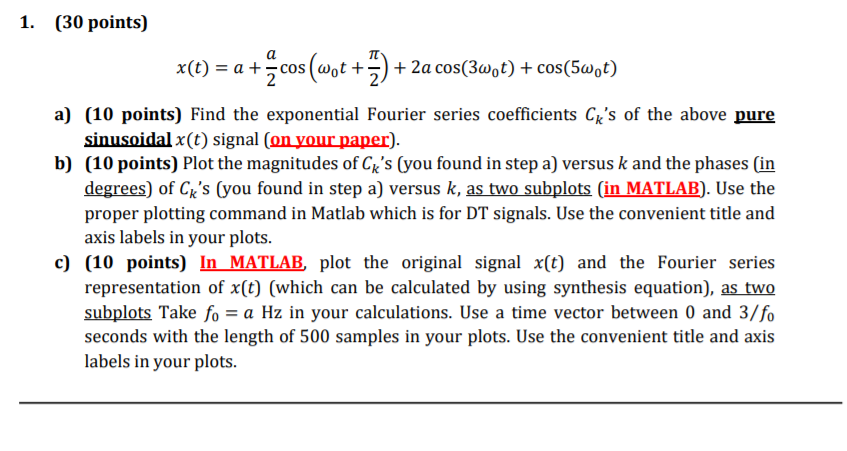
1. (30 points) x(t) = a + = a +cos(wet + 3) + 2a cos(3wot) + cos(5wot) a) (10 points) Find the exponential Fourier series coefficients Ck's of the above pure sinusoidal x(t) signal (on your paper). b) (10 points) Plot the magnitudes of Ck's (you found in step a) versus k and the phases (in degrees) of Ck's (you found in step a) versus k, as two subplots (in MATLAB). Use the proper plotting command in Matlab which is for DT signals. Use the convenient title and axis labels in your plots. c) (10 points) In MATLAB, plot the original signal x(t) and the Fourier series representation of x(t) (which can be calculated by using synthesis equation), as two subplots Take fo = a Hz in your calculations. Use a time vector between 0 and 3/fo seconds with the length of 500 samples in your plots. Use the convenient title and axis labels in your plots. 1. (30 points) x(t) = a + = a +cos(wet + 3) + 2a cos(3wot) + cos(5wot) a) (10 points) Find the exponential Fourier series coefficients Ck's of the above pure sinusoidal x(t) signal (on your paper). b) (10 points) Plot the magnitudes of Ck's (you found in step a) versus k and the phases (in degrees) of Ck's (you found in step a) versus k, as two subplots (in MATLAB). Use the proper plotting command in Matlab which is for DT signals. Use the convenient title and axis labels in your plots. c) (10 points) In MATLAB, plot the original signal x(t) and the Fourier series representation of x(t) (which can be calculated by using synthesis equation), as two subplots Take fo = a Hz in your calculations. Use a time vector between 0 and 3/fo seconds with the length of 500 samples in your plots. Use the convenient title and axis labels in your plots
Step by Step Solution
There are 3 Steps involved in it

Get step-by-step solutions from verified subject matter experts