

Question: AA 1 - 2 Comparative Analysis LO A 1 , A 2 Key comparative figures for both Apple and Google follow. Numbers shown are reported
AA Comparative Analysis LO A A
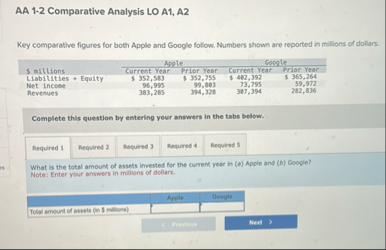
Key comparative figures for both Apple and Google follow. Numbers shown are reported in millions of dollars.
tableample,Coogle$ miltions.,Current Year,Prior Year,Current Year,riar yearLiabilities Equity,$ $ $ $ Net income,eRevenues
Complete this question by entering your answers in the tabs below.
Required I
Required
Required
What ts the tetal amount of assets invested for the confint year in a Apple and b Coople?
Note: Enter your answers in millions of dollars.
tableTotal amount of assests in millionsAvele
AA Comparative Analysis LO A A
Key comparative figures for both Apple and Google follow. Numbers shown are reported in millions of dollars.
table$ nillions,Current Year,Priar Year,Current Yrar,Fribr rearLiabitities Equity,$ $ $ Net incese,Revenues
Complete this question by entering your answers in the tabs below.
Required
Required
Repulred
Repulred
seablyseds
What is the correntyear reflum on assets or a Applegred b Cocipt? Nobe: Round your percentage answers to decimal place.
tableAopleCascy'sRehum on assels,,
AA Comparative Analysis LO A A
Key comparative figures for both Apple and Google follow, Numbers shown are reported in millions of dollars.
table$ millions,Apple,GoogleCurrent Year,Prior Year,Current Year,Priar YearLiabilities Equity,$ $ $ Net Inteme,Revenues
Complete this question by entering your answers in the tabs below.
Required
Required
Required
Required
How much are currentyear expenses for a Apple and t Goople?
Note: Enter your answers in millions of dollars.
tableCurrentyear expenses in millions
AA Comparative Analysis LO A A
Key comparative figures for both Apple and Google follow. Numbers shown are reported in millions of dollars.
tabletableReptlyExylte$ millions,Current Year,Priar Year,Current Year,Priar YearLiabitities Equity,$ $ $ $ Net Income,Revenues
Complete this question by entering your answers in the tabs below.
Required
Required
Required
Required
a Is the curretyear refum en assets better than the retiam of competions for Apple?
Is the currentyear return en assats better than the reture of compabiers for Ocogle?AA Comparative Analysis LO A A
Key comparative figures for both Apple and Google follow. Numbers shown are reported in millions of dollars.
tableBYExyerle millions,Current rear,Priar Year,Current Tear,HABr TearLiabilities Equity,$ $ $ $ Net Income,Revehues eve
Complete this question by entering your answers in the tabs below.
Required Required
Regulred
Relying only on reburn on assets, would we invest in Coogie or Apple?
We would lenest in
Step by Step Solution
There are 3 Steps involved in it
1 Expert Approved Answer
Step: 1 Unlock

Question Has Been Solved by an Expert!
Get step-by-step solutions from verified subject matter experts
Step: 2 Unlock
Step: 3 Unlock