

Question: COMPARATIVE ANALYSIS A1 AA 4-2 Key comparative figures for Apple and Google follow. $ millions Net Sales ........ Cost of Sales. Samsung $197,691 126,336 Apple
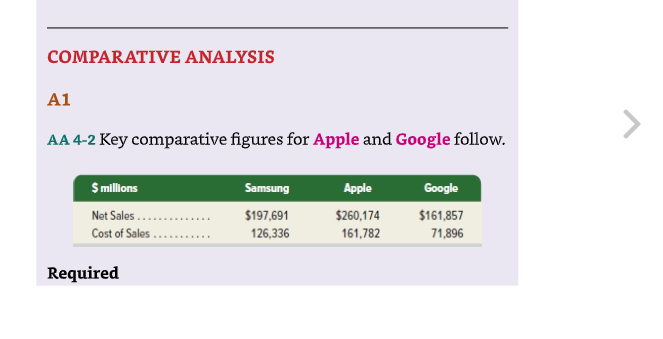
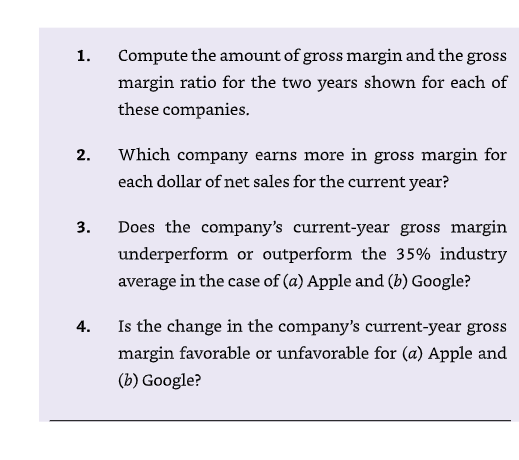
COMPARATIVE ANALYSIS A1 AA 4-2 Key comparative figures for Apple and Google follow. $ millions Net Sales ........ Cost of Sales. Samsung $197,691 126,336 Apple $260,174 161,782 Google $161,857 71,896 Required 1. Compute the amount of gross margin and the gross margin ratio for the two years shown for each of these companies. 2. Which company earns more in gross margin for each dollar of net sales for the current year? 3. Does the company's current-year gross margin underperform or outperform the 35% industry average in the case of (a) Apple and (b) Google? 4. Is the change in the company's current-year gross margin favorable or unfavorable for (a) Apple and (b) Google
Step by Step Solution
There are 3 Steps involved in it

Get step-by-step solutions from verified subject matter experts