

Question: AA 12-3 Extended Analysis LO C1 Key comparative information for Samsung. Apple, and Google follows. 1 Year Prior $ 47,971 232,792 Samsung Apple Google
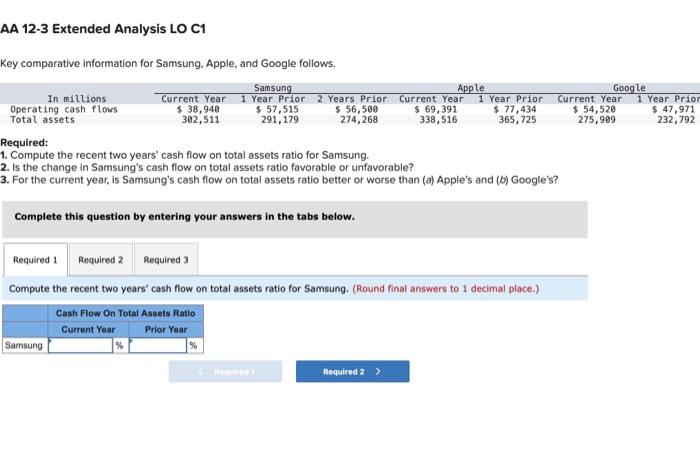
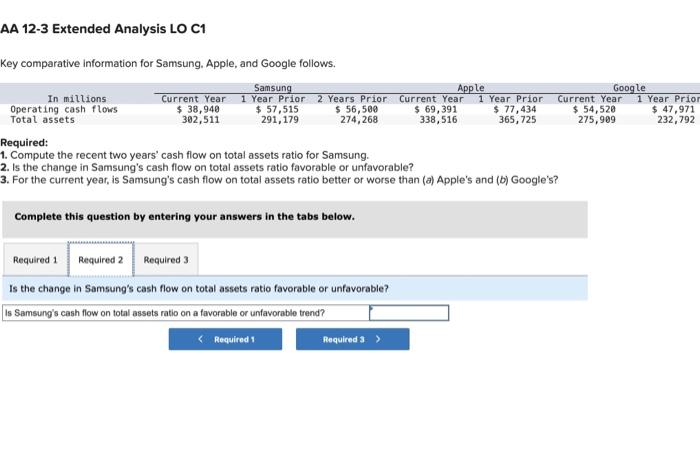
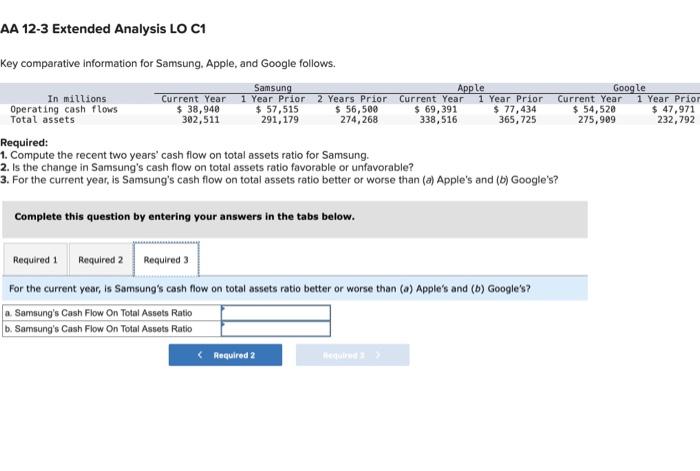
AA 12-3 Extended Analysis LO C1 Key comparative information for Samsung. Apple, and Google follows. 1 Year Prior $ 47,971 232,792 Samsung Apple Google In millions Operating cash flows Total assets Current Year $ 38,940 302,511 1 Year Prior 2 Years Prior $ 57,515 $ 56,500 291,179 274,268 Current Year 1 Year Prior $ 69,391 $ 77,434 338,516 365,725 Current Year $ 54,520 275,909 Required: 1. Compute the recent two years' cash flow on total assets ratio for Samsung. 2. Is the change in Samsung's cash flow on total assets ratio favorable or unfavorable? 3. For the current year, is Samsung's cash flow on total assets ratio better or worse than (a) Apple's and (b) Google's? Complete this question by entering your answers in the tabs below. Required 1 Required 2 Required 3 Compute the recent two years' cash flow on total assets ratio for Samsung. (Round final answers to 1 decimal place.) Cash Flow On Total Assets Ratio Current Year Samsung Prior Year % Required Y Required 2 >
Step by Step Solution
There are 3 Steps involved in it

Get step-by-step solutions from verified subject matter experts