

Question: AA 12-3 Global Analysis LO C1 Key comparative information for Samsung, Apple, and Google follows. Samsung Apple Google In millions Operating cash flows Total assets
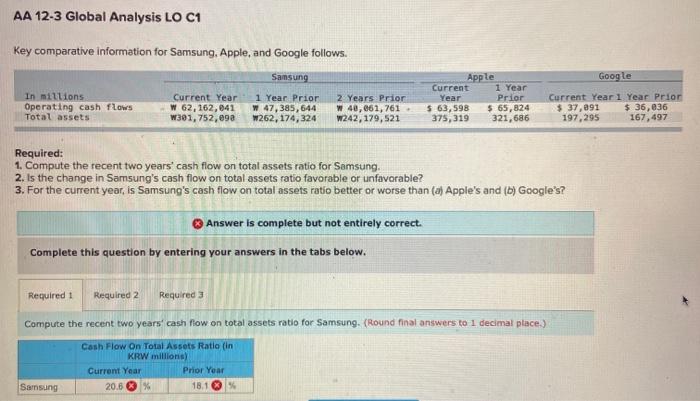
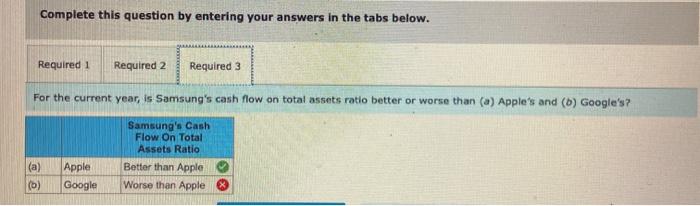
AA 12-3 Global Analysis LO C1 Key comparative information for Samsung, Apple, and Google follows. Samsung Apple Google In millions Operating cash flows Total assets Current Year W 62, 162,041 W301,752, e9a 1 Year Prior W 47,385,644 W262, 174,324 2 Years Prior W 40,061,761 - W242,179,521 Current Year $ 63,598 375, 319 1 Year Prior $ 65,824 321,686 Current Year 1 Year Prior $ 37,091 $ 36,036 197,295 167,497 Required: 1. Compute the recent two years' cash flow on total assets ratio for Samsung 2. Is the change in Samsung's cash flow on total assets ratio favorable or unfavorable? 3. For the current year, is Samsung's cash flow on total assets ratio better or worse than (a) Apple's and (b) Google's? Answer is complete but not entirely correct. Complete this question by entering your answers in the tabs below. Required 1 Required 2 Required 3 Compute the recent two years' cash flow on total assets ratio for Samsung (Round final answers to 1 decimal place.) Cash Flow On Total Assets Ratio (in KRW millions Current Year Prior Year 20.6 % 18.1 Samsung Complete this question by entering your answers in the tabs below. Required 1 Required 2 Required 3 For the current year, is Samsung's cash flow on total assets ratio better or worse than (0) Apple's and (b) Google's? Samsung's Cash Flow On Total Assets Ratio Better than Apple Worse than Apple (a) Apple Google (0)
Step by Step Solution
There are 3 Steps involved in it

Get step-by-step solutions from verified subject matter experts