

Question: AA 13-2 Comparative Analysis LO C1, P2 Key figures for Apple and Google follow. $ millions Cash and equivalents Apple Google Accounts receivable, net
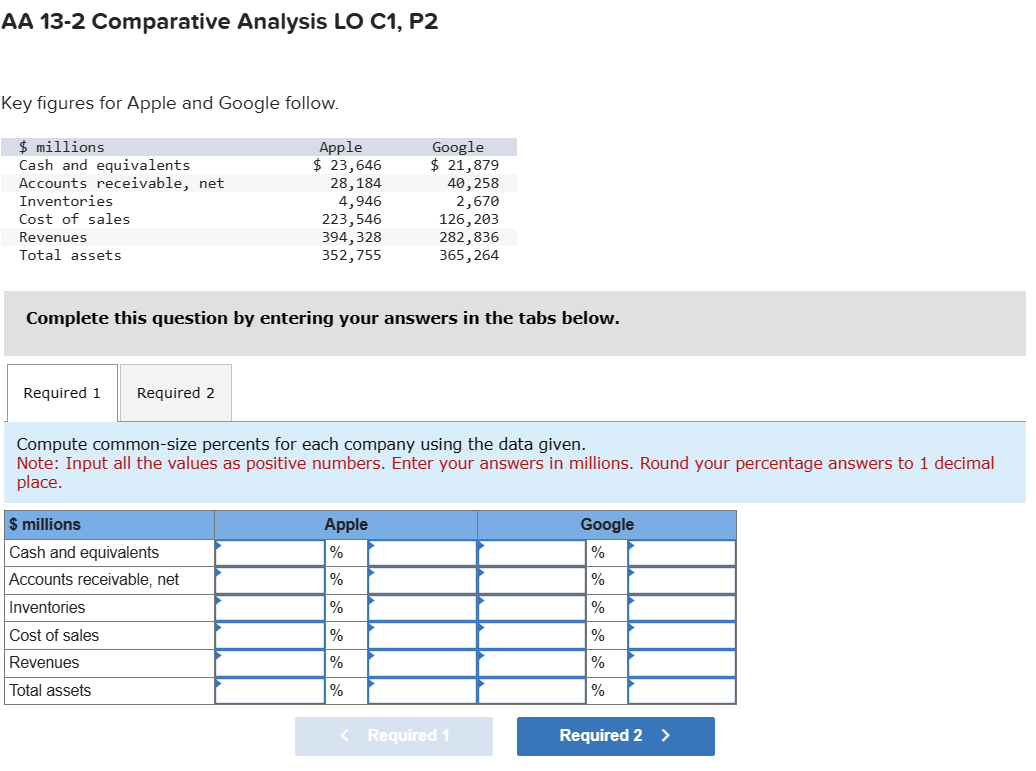
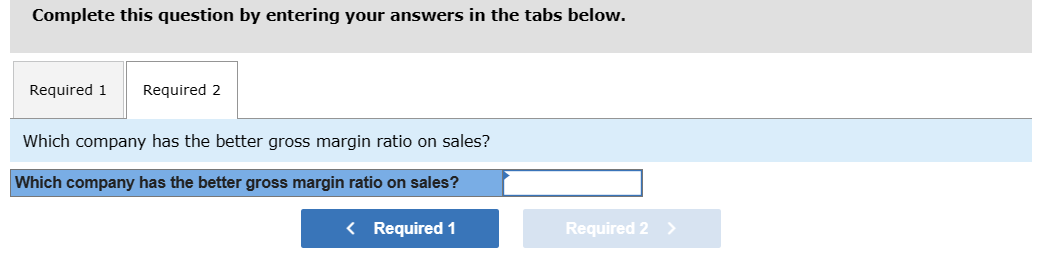
AA 13-2 Comparative Analysis LO C1, P2 Key figures for Apple and Google follow. $ millions Cash and equivalents Apple Google Accounts receivable, net $ 23,646 28,184 $ 21,879 40,258 Inventories 4,946 2,670 Cost of sales 223,546 126,203 Revenues 394,328 282,836 Total assets 352,755 365,264 Complete this question by entering your answers in the tabs below. Required 1 Required 2 Compute common-size percents for each company using the data given. Note: Input all the values as positive numbers. Enter your answers in millions. Round your percentage answers to 1 decimal place. $ millions Cash and equivalents Apple % Accounts receivable, net % Inventories % Cost of sales % Revenues % Total assets % Google % % % % % % < Required 1 Required 2 > Complete this question by entering your answers in the tabs below. Required 1 Required 2 Which company has the better gross margin ratio on sales? Which company has the better gross margin ratio on sales? < Required 1 Required 2 >
Step by Step Solution
There are 3 Steps involved in it

Get step-by-step solutions from verified subject matter experts