

Question: AA 17-2 Comparative Analysis LO C1, P2 Key figures for Apple and Google follow. $ millions Cash and equivalents Apple $ 48,844 Google $ 18,498
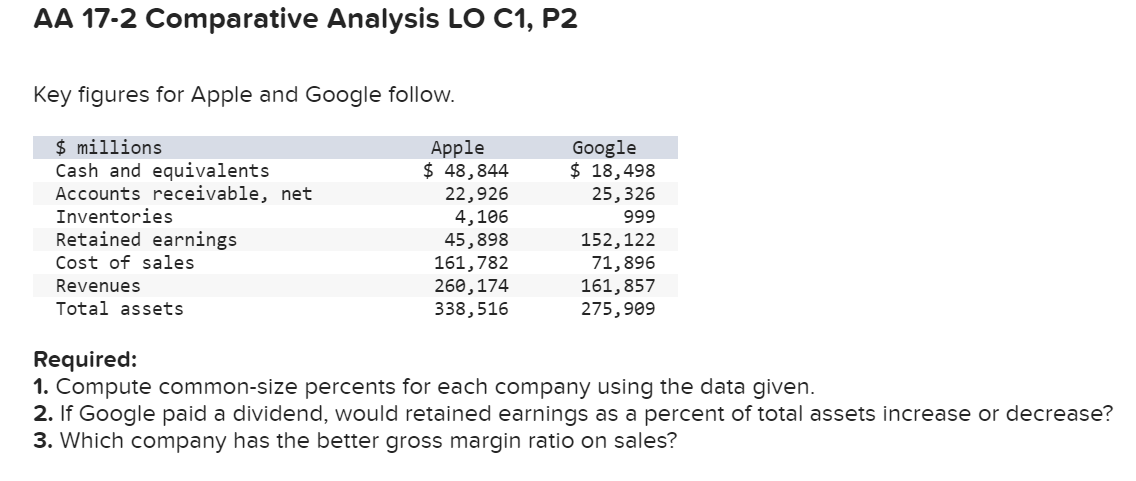
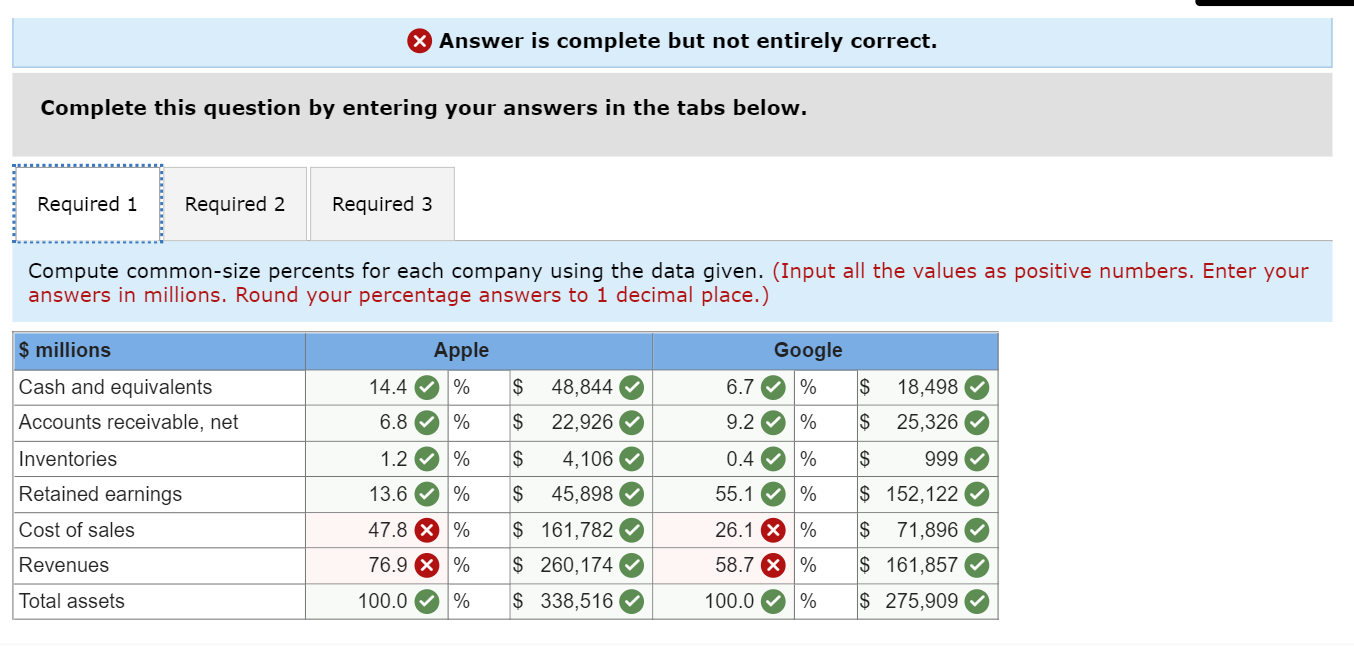
AA 17-2 Comparative Analysis LO C1, P2 Key figures for Apple and Google follow. $ millions Cash and equivalents Apple $ 48,844 Google $ 18,498 Accounts receivable, net 22,926 Inventories 4,106 Retained earnings 45,898 25,326 999 152,122 Revenues Cost of sales Total assets Required: 161,782 71,896 260,174 161,857 338,516 275,909 1. Compute common-size percents for each company using the data given. 2. If Google paid a dividend, would retained earnings as a percent of total assets increase or decrease? 3. Which company has the better gross margin ratio on sales? Answer is complete but not entirely correct. Complete this question by entering your answers in the tabs below. Required 1 _ Required 2 Required 3 Compute common-size percents for each company using the data given. (Input all the values as positive numbers. Enter your answers in millions. Round your percentage answers to 1 decimal place.) S millions Apple Google Cash and equivalents 14.4 Accounts receivable, net 6.8 % % S S 48,844 22,926 6.7 % $ 18,498 9.2 % $ 25,326 Inventories 1.2% $ 4,106 Retained earnings 13.6 % $ 45,898 55.1 0.4 % % $ 999 $ 152,122 Cost of sales 47.8 % $ 161,782 26.1 % $ 71,896 Revenues Total assets 100.0 76.9 % % $ 260,174 $ 338,516 100.0 58.7 % % $ 161,857 $ 275,909
Step by Step Solution
There are 3 Steps involved in it

Get step-by-step solutions from verified subject matter experts