

Question: AA 17-2 Comparative Analysis LO C1, P2 Key figures for Apple and Google follow. 5 millions Apple Cash and equivalents $ 48,844 Accounts receivable, net
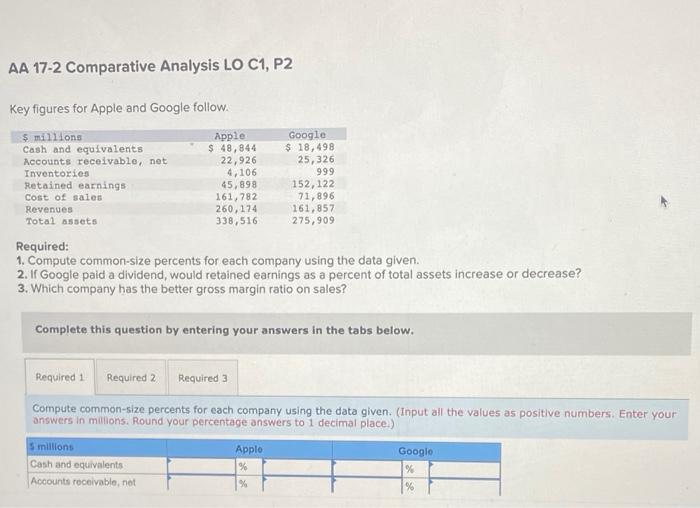
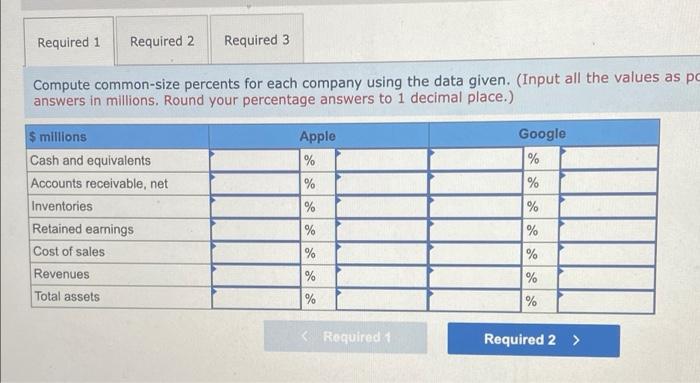
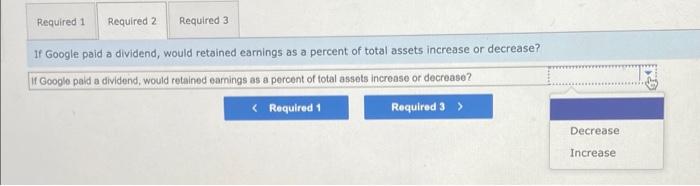
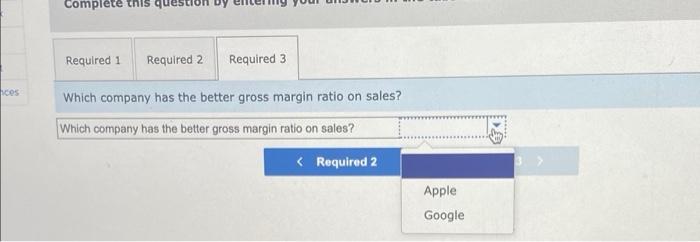
AA 17-2 Comparative Analysis LO C1, P2 Key figures for Apple and Google follow. 5 millions Apple Cash and equivalents $ 48,844 Accounts receivable, net 22,926 Inventories 4,106 Retained earnings 45,898 Cost of sales 161,782 Revenues 260,174 Total assets 338,516 Google $ 18,498 25, 326 999 152,122 71,896 161,857 275,909 Required: 1. Compute common-size percents for each company using the data given. 2. If Google paid a dividend, would retained earnings as a percent of total assets increase or decrease? 3. Which company has the better gross margin ratio on sales? Complete this question by entering your answers in the tabs below. Required 1 Required 2 Required 3 Compute common-size percents for each company using the data given. (Input all the values as positive numbers. Enter your answers in millons. Round your percentage answers to 1 decimal place) 5 millions Cash and equivalents Accounts receivable.net Applo % % Google % % Required 1 Required 2 Required 3 Compute common-size percents for each company using the data given. (Input all the values as po answers in millions. Round your percentage answers to 1 decimal place.) Google % $ millions Cash and equivalents Accounts receivable, net Inventories Retained earings Cost of sales Revenues Total assets Apple % % % % % % % % % % % % % Required 1 Required 2 Required 3 If Google paid a dividend, would retained earnings as a percent of total assets increase or decrease? If Google pald a dividend, would retained earnings as a percent of total assets increase or decreaso? Decrease Increase complete this quest Required 1 Required 2 Required 3 hoes Which company has the better gross margin ratio on sales? Which company has the better gross margin ratio on sales?
Step by Step Solution
There are 3 Steps involved in it

Get step-by-step solutions from verified subject matter experts