

Question: AA 4-2 Comparative Analysis LO A1 Key figures for the recent two years of both Apple and Google follow. Apple Google $ millions Current
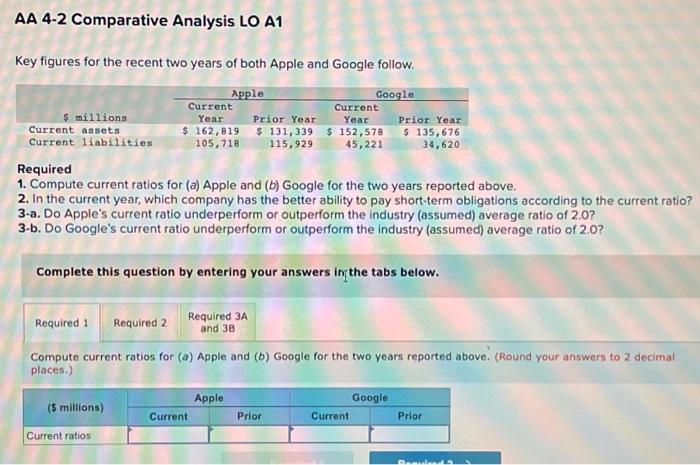

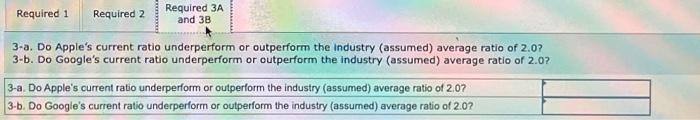
AA 4-2 Comparative Analysis LO A1 Key figures for the recent two years of both Apple and Google follow. Apple Google $ millions Current Year Current assets Current liabilities $ 162,819 105,718 Current Prior Year Year $131,339 $ 152,578 115,929 45,221 Prior Year $ 135,676 34,620 Required 1. Compute current ratios for (a) Apple and (b) Google for the two years reported above. 2. In the current year, which company has the better ability to pay short-term obligations according to the current ratio? 3-a. Do Apple's current ratio underperform or outperform the industry (assumed) average ratio of 2.0? 3-b. Do Google's current ratio underperform or outperform the industry (assumed) average ratio of 2.0? Complete this question by entering your answers in the tabs below. Required 1 Required 2 Required 3A and 38 Compute current ratios for (a) Apple and (b) Google for the two years reported above. (Round your answers to 2 decimal places.) Apple Google ($ millions) Current Prior Current Prior Current ratios
Step by Step Solution
There are 3 Steps involved in it

Get step-by-step solutions from verified subject matter experts