

Question: AA 3-2 Comparative Analysis LO A1 Key figures for the recent two years of both Apple and Google follow. $ millions Net income Net sales
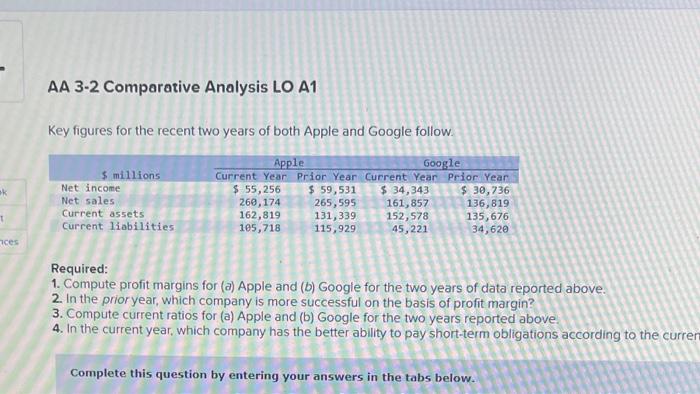
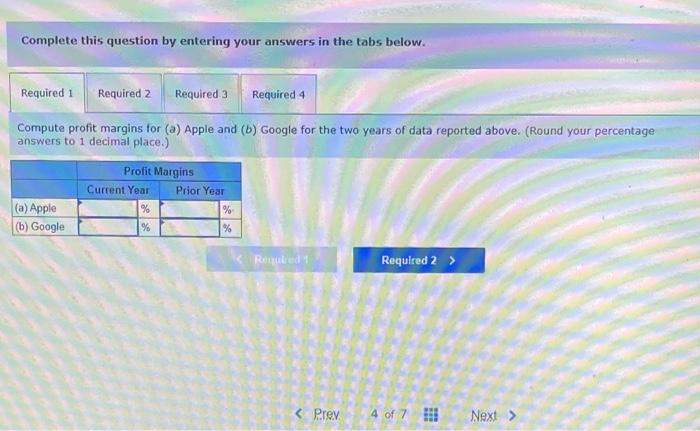
AA 3-2 Comparative Analysis LO A1 Key figures for the recent two years of both Apple and Google follow. $ millions Net income Net sales Current assets Current liabilities Apple Google Current Year Prior Year Current Year Prior Yean $ 55, 256 $ 59,531 $ 34,343 $ 30,736 269,174 265,595 161,857 136,819 162,819 131,339 152,578 135,676 105,718 115,929 45,221 34,620 + ces Required: 1. Compute profit margins for (a) Apple and (b) Google for the two years of data reported above. 2. In the prior year, which company is more successful on the basis of profit margin? 3. Compute current ratios for (a) Apple and (b) Google for the two years reported above. 4. In the current year, which company has the better ability to pay short-term obligations according to the curren Complete this question by entering your answers in the tabs below. Complete this question by entering your answers in the tabs below. Required 1 Required 2 Required 3 Required 4 Compute profit margins for (a) Apple and (b) Google for the two years of data reported above. (Round your percentage answers to 1 decimal place.) Profit Margins Current Year Prior Year % % (a) Apple (b) Google % %
Step by Step Solution
There are 3 Steps involved in it

Get step-by-step solutions from verified subject matter experts