

Question: AA 8-2 Comparative Analysis LO A1 Comparative figures for Apple and Google follow. Apple Current One Year $ millions Year Prior Total assets $375, 319
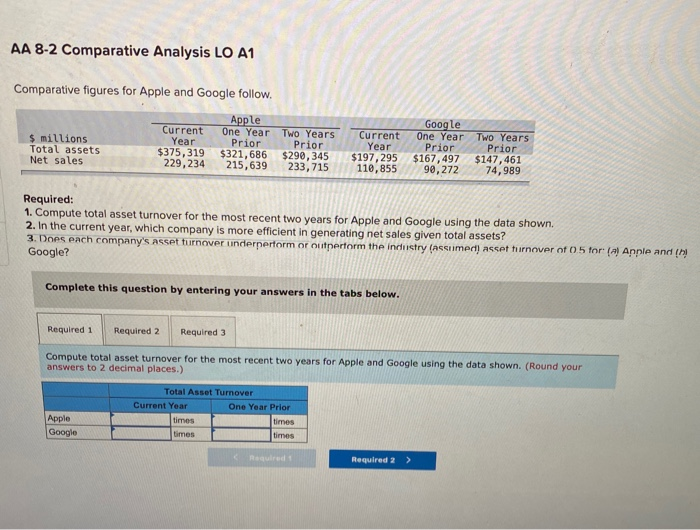
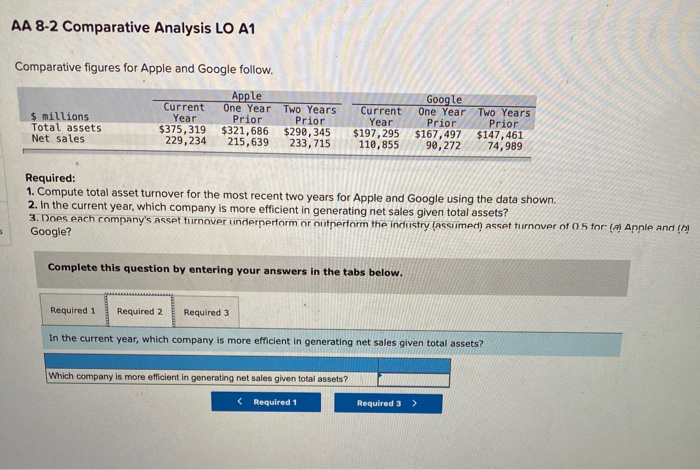
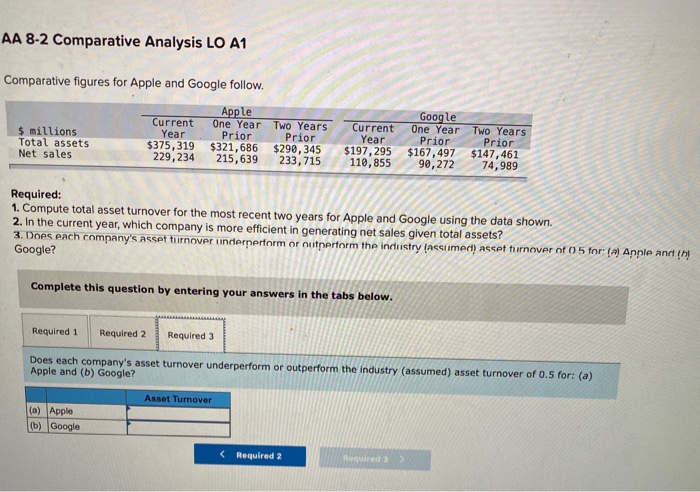
AA 8-2 Comparative Analysis LO A1 Comparative figures for Apple and Google follow. Apple Current One Year $ millions Year Prior Total assets $375, 319 $321,686 Net sales 229,234 215,639 TWO Years Prior $290, 345 233,715 Current Year $197, 295 110,855 Google One Year TWO Years Prior Prior $167,497 $147,461 90,272 74,989 Required: 1. Compute total asset turnover for the most recent two years for Apple and Google using the data shown. 2. In the current year, which company is more efficient in generating net sales given total assets? 3. Does each company's asset turnover underperform or outperform the industry (assumed) asset turnover of 0.5 for(a) Anple and the Google? Complete this question by entering your answers in the tabs below. Required 1 Required 2 Required 3 Compute total asset turnover for the most recent two years for Apple and Google using the data shown. (Round your answers to 2 decimal places.) Total Asset Turnover Current Year One Year Prior times times times times Apple Google Required 2 > AA 8-2 Comparative Analysis LO A1 Comparative figures for Apple and Google follow. Apple Current One Year Two Years $ millions Year Prior Prior Total assets $375, 319 $321,686 $290, 345 Net sales 229, 234 215, 639 233,715 Current Year $197, 295 110,855 Google One Year TWO Years Prior Prior $167,497 $147,461 90,272 74,989 Required: 1. Compute total asset turnover for the most recent two years for Apple and Google using the data shown. 2. In the current year, which company is more efficient in generating net sales given total assets? 3. Does each company's asset turnover underperform or outperform the industry (assumech) asset turnover of 05 for Apple and ! Google? 5 Complete this question by entering your answers in the tabs below. Required 1 Required 2 Required 3 In the current year, which company is more efficient in generating net sales given total assets? Which company is more efficient in generating net sales given total assets? AA 8-2 Comparative Analysis LO A1 Comparative figures for Apple and Google follow. $ millions Total assets Net sales Current Year $375,319 229,234 Apple One Year Prior $321,686 215, 639 Two Years Prior $290, 345 233,715 Current Year $197,295 110,855 Google One Year Two Years Prior Prior $167,497 $147, 461 90,272 74,989 Required: 1. Compute total asset turnover for the most recent two years for Apple and Google using the data shown. 2. In the current year, which company is more efficient in generating net sales given total assets? 3. Does each company's asset turnover underperform or outperform the industry assumed) asset turnover of 05 for !) Annle and in! Google? Complete this question by entering your answers in the tabs below. Required 1 Required 2 Required 3 Does each company's asset turnover underperform or outperform the industry (assumed) asset turnover of 0.5 for: (a) Apple and (b) Google? Asset Turnover (a) Apple (b) Google
Step by Step Solution
There are 3 Steps involved in it

Get step-by-step solutions from verified subject matter experts