

Question: Aa Bbccdee Aa Bbccdee AaBbCcDc AaBbCcDdEt Aabb No Spacing Heading 1 Heading 2 Title Normal Determine the sample size for each of the control procedures
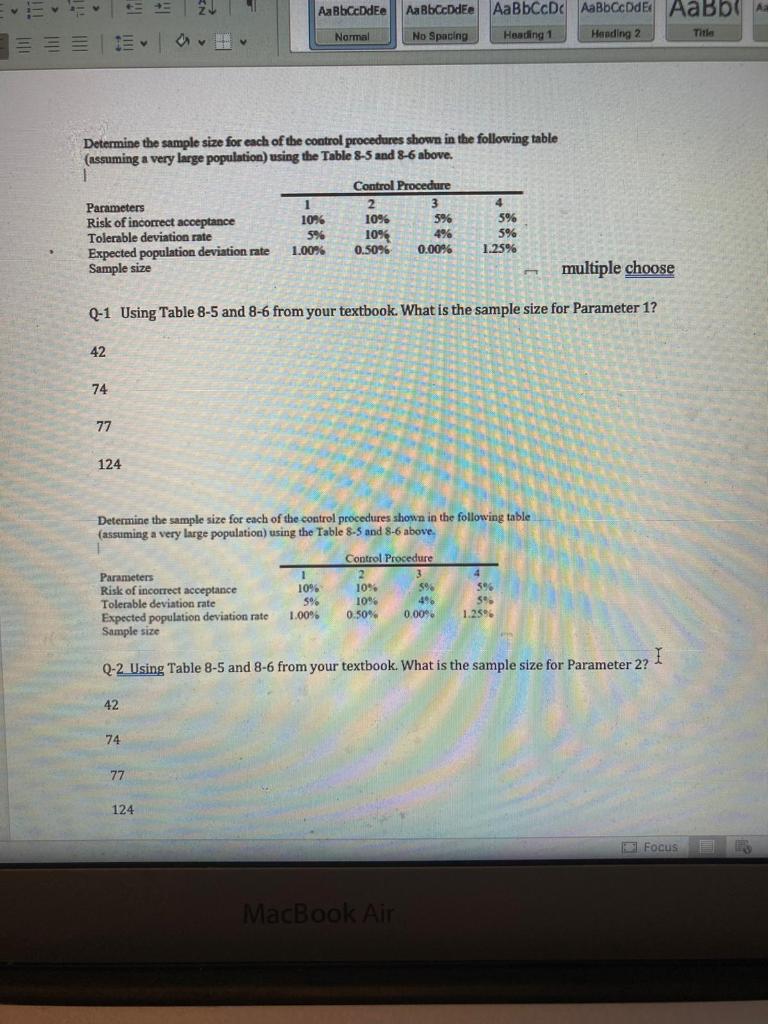
Aa Bbccdee Aa Bbccdee AaBbCcDc AaBbCcDdEt Aabb No Spacing Heading 1 Heading 2 Title Normal Determine the sample size for each of the control procedures shown in the following table (assuming a very large population) using the Table 8-5 and 8-6 above. Parameters Risk of incorrect acceptance Tolerable deviation rate Expected population deviation rate Sample size 10% 5% 1.00% Control Procedure 2 3 10% 5% 10% 4% 0.00% 4 5% 5% 1.25% 0.50% multiple choose Q-1 Using Table 8-5 and 8-6 from your textbook. What is the sample size for Parameter 1? 42 74 77 124 Determine the sample size for each of the control procedures shown in the following table (assuming a very large population) using the Table 8-5 and 8-6 above. Control Procedure Parameters 1 12 3 4 Risk of incorrect acceptance 10% 10% 598 596 Tolerable deviation rate 5% 10% 496 59 Expected population deviation rate 1.00% 0.50% 0.00 1.25 Sample size I Q-2 Using Table 8-5 and 8-6 from your textbook. What is the sample size for Parameter 2? 42 74 77 124 Focus MacBook Air Aa Bbccdee Aa Bbccdee AaBbCcDc AaBbCcDdEt Aabb No Spacing Heading 1 Heading 2 Title Normal Determine the sample size for each of the control procedures shown in the following table (assuming a very large population) using the Table 8-5 and 8-6 above. Parameters Risk of incorrect acceptance Tolerable deviation rate Expected population deviation rate Sample size 10% 5% 1.00% Control Procedure 2 3 10% 5% 10% 4% 0.00% 4 5% 5% 1.25% 0.50% multiple choose Q-1 Using Table 8-5 and 8-6 from your textbook. What is the sample size for Parameter 1? 42 74 77 124 Determine the sample size for each of the control procedures shown in the following table (assuming a very large population) using the Table 8-5 and 8-6 above. Control Procedure Parameters 1 12 3 4 Risk of incorrect acceptance 10% 10% 598 596 Tolerable deviation rate 5% 10% 496 59 Expected population deviation rate 1.00% 0.50% 0.00 1.25 Sample size I Q-2 Using Table 8-5 and 8-6 from your textbook. What is the sample size for Parameter 2? 42 74 77 124 Focus MacBook Air
Step by Step Solution
There are 3 Steps involved in it

Get step-by-step solutions from verified subject matter experts