

Question: AaBbCcDdE AaBbCcDdE AaBbCcDc AaBbCcDdEr Aa BbCcDdEe AaBb( AaBbCCDdE AaB Title Subtitle Subtle A Normal No Spacing Heading 1 Heading 2 Heading 3 Exercise 2: Drawing
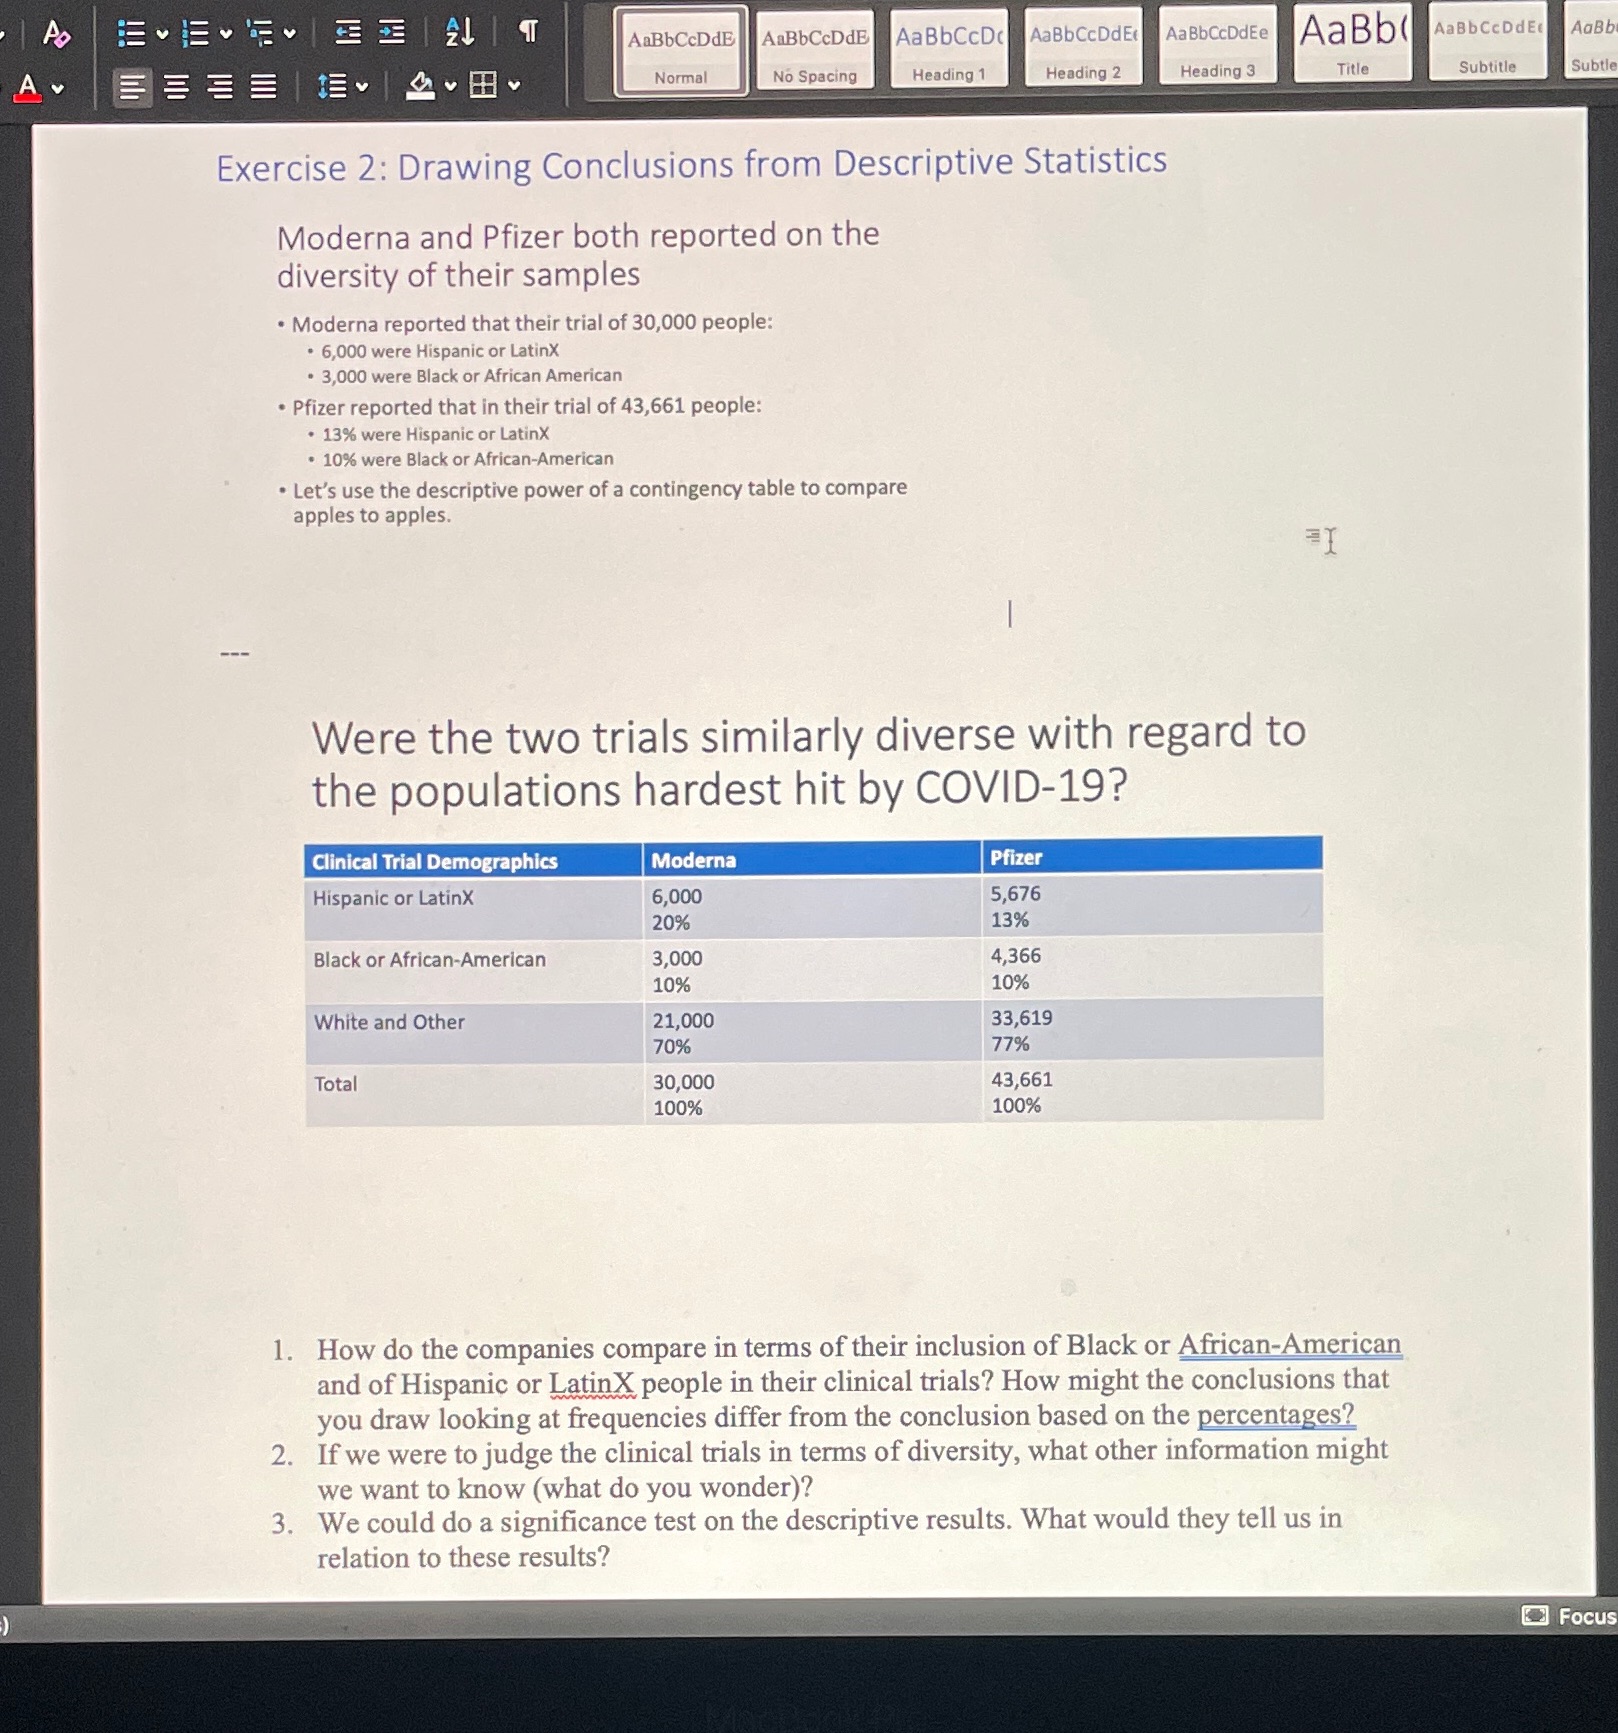
AaBbCcDdE AaBbCcDdE AaBbCcDc AaBbCcDdEr Aa BbCcDdEe AaBb( AaBbCCDdE AaB Title Subtitle Subtle A Normal No Spacing Heading 1 Heading 2 Heading 3 Exercise 2: Drawing Conclusions from Descriptive Statistics Moderna and Pfizer both reported on the diversity of their samples Moderna reported that their trial of 30,000 people: . 6,000 were Hispanic or LatinX 3,000 were Black or African American . Pfizer reported that in their trial of 43,661 people: . 13% were Hispanic or LatinX 10% were Black or African-American . Let's use the descriptive power of a contingency table to compare apples to apples. Were the two trials similarly diverse with regard to the populations hardest hit by COVID-19? Clinical Trial Demographics Moderna Pfizer Hispanic or LatinX 6,000 5,676 20% 13% Black or African-American ,000 4,366 10% 10% White and Other 21,000 33 , 619 70% 77% Total 30,000 43,661 100% 100% 1. How do the companies compare in terms of their inclusion of Black or African-American and of Hispanic or LatinX people in their clinical trials? How might the conclusions that you draw looking at frequencies differ from the conclusion based on the percentages? 2. If we were to judge the clinical trials in terms of diversity, what other information might we want to know (what do you wonder)? 3. We could do a significance test on the descriptive results. What would they tell us in relation to these results? Focus
Step by Step Solution
There are 3 Steps involved in it

Get step-by-step solutions from verified subject matter experts