

Question: AaBbCcDdEe AaBbCcDdEe AaBbCcDc AaBbCCD E Normal No Spacing Heading 1 Heading PSYC 355 Problem Set 3: Cumulative Knowledge Question Research, Scenario: A manager would like
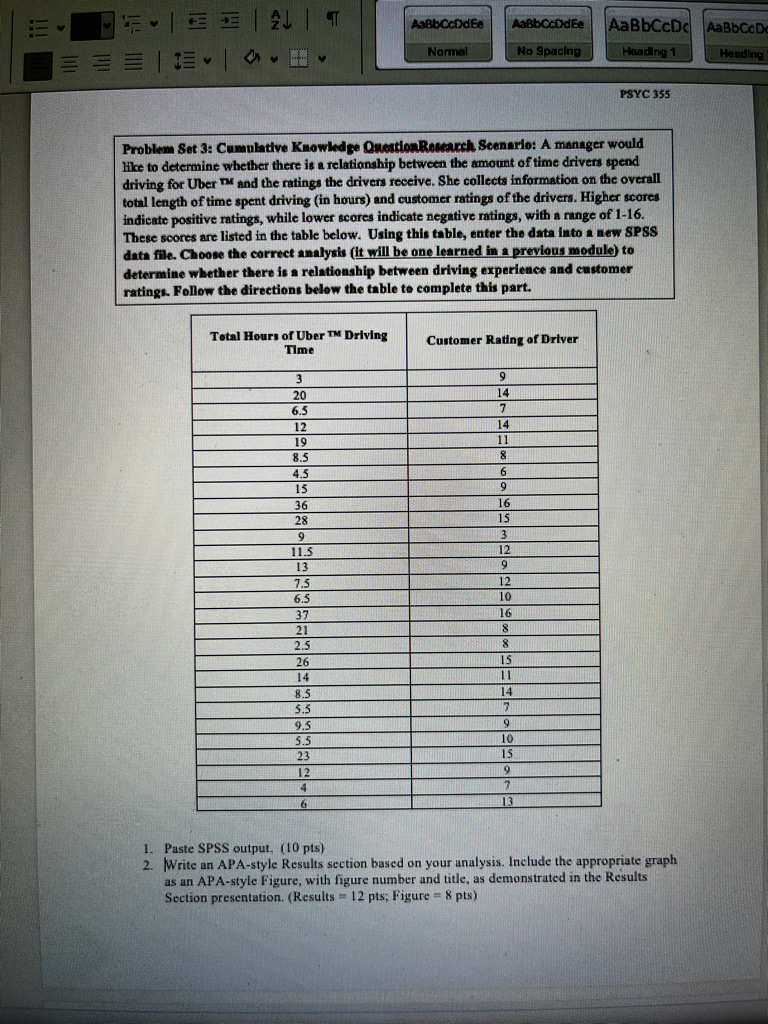
AaBbCcDdEe AaBbCcDdEe AaBbCcDc AaBbCCD E Normal No Spacing Heading 1 Heading PSYC 355 Problem Set 3: Cumulative Knowledge Question Research, Scenario: A manager would like to determine whether there is a relationship between the amount of time drivers spend driving for Uber TM and the ratings the drivers receive. She collects information on the overall total length of time spent driving (in hours) and customer ratings of the drivers. Higher scores indicate positive ratings, while lower scores indicate negative ratings, with a range of 1-16. These scores are listed in the table below. Using this table, enter the data into a new SPSS data file. Choose the correct analysis (it will be one learned in a previous module) to determine whether there is a relationship between driving experience and customer ratings. Follow the directions below the table to complete this part. Total Hours of Uber TM Driving Customer Rating of Driver Time 3 20 6.5 12 19 8.5 4.5 15 26 8.5 5.5 5.5 23 12 4 1. Paste SPSS output. (10 pts) 2. Write an APA-style Results section based on your analysis. Include the appropriate graph as an APA-style Figure, with figure number and title, as demonstrated in the Results Section presentation. (Results = 12 pts; Figure = 8 pts)
Step by Step Solution
There are 3 Steps involved in it

Get step-by-step solutions from verified subject matter experts