

Question: Absorbance Values for Physiology- Effect of pH The absorbance values for the haloarchaeans grown at same concentration (2.5 M) of sodium chloride (NaCl) but
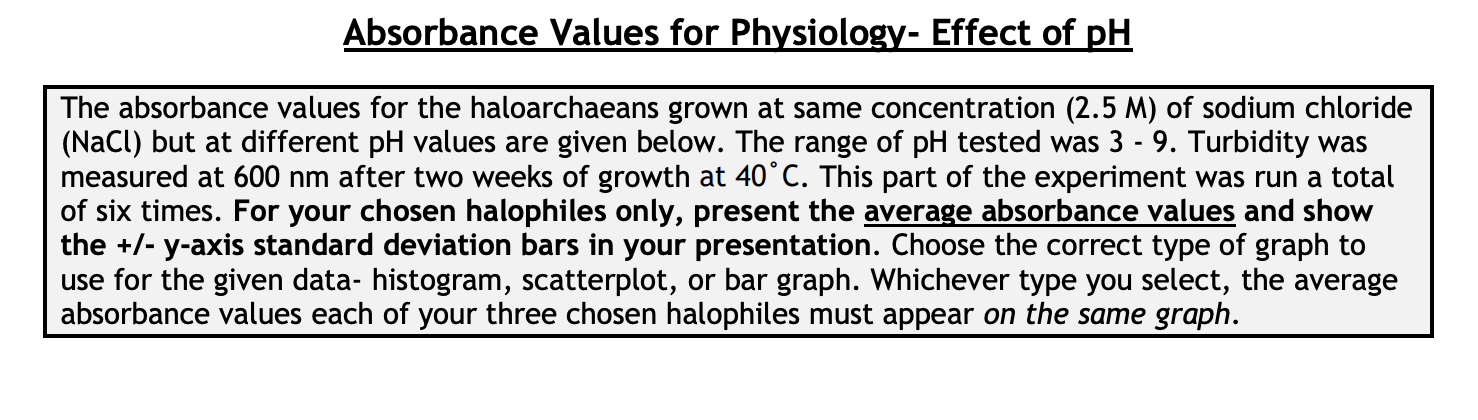

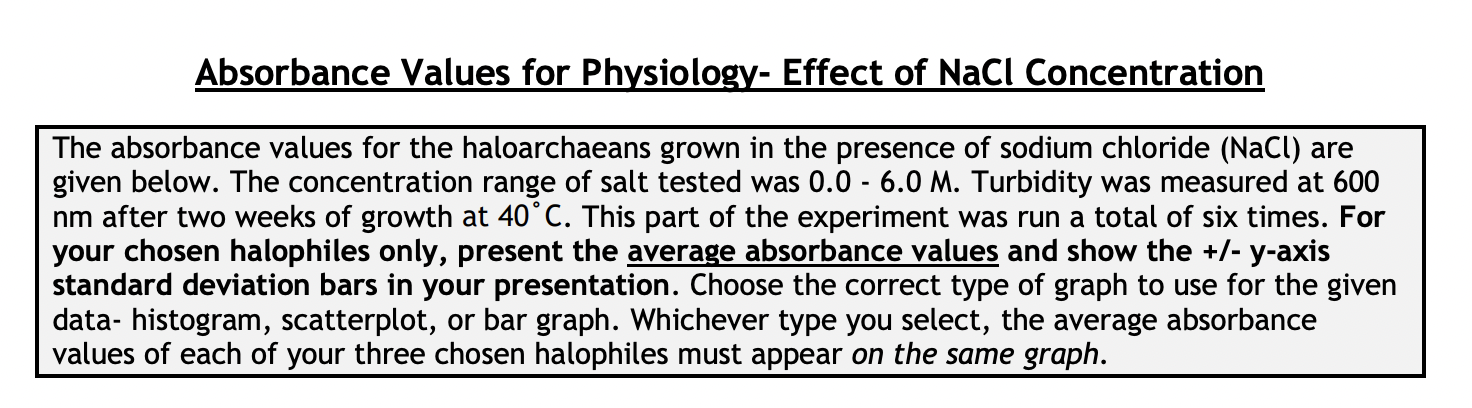
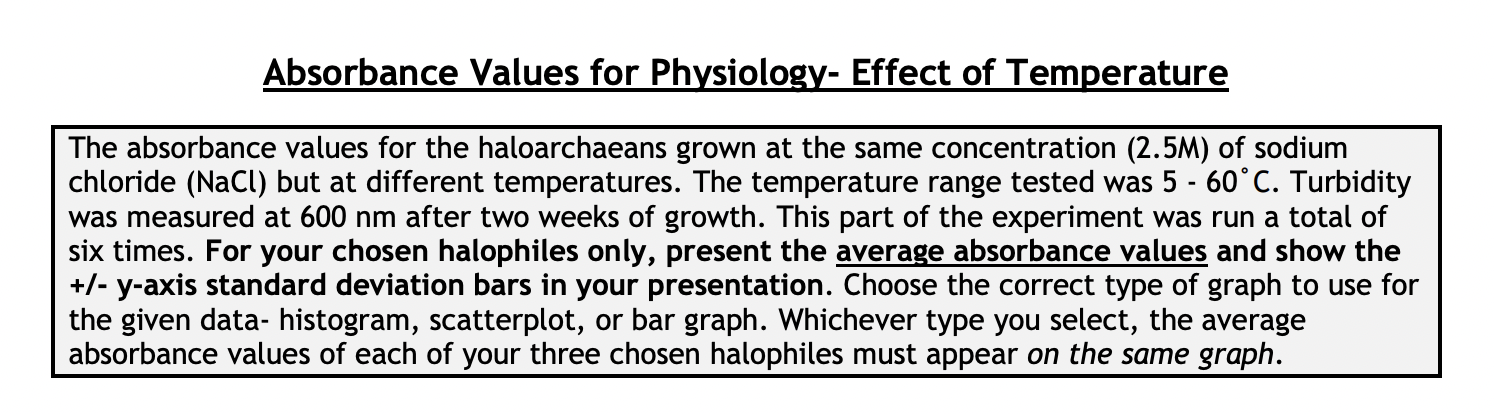
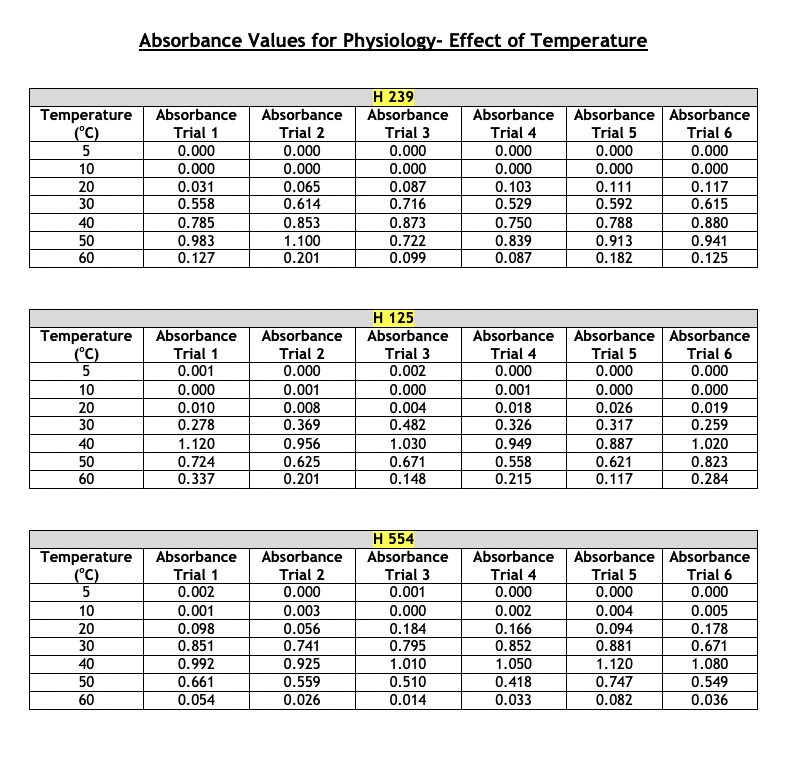
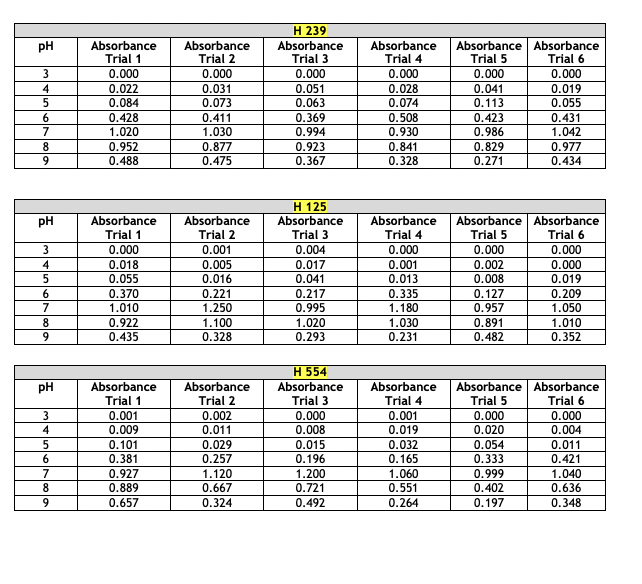
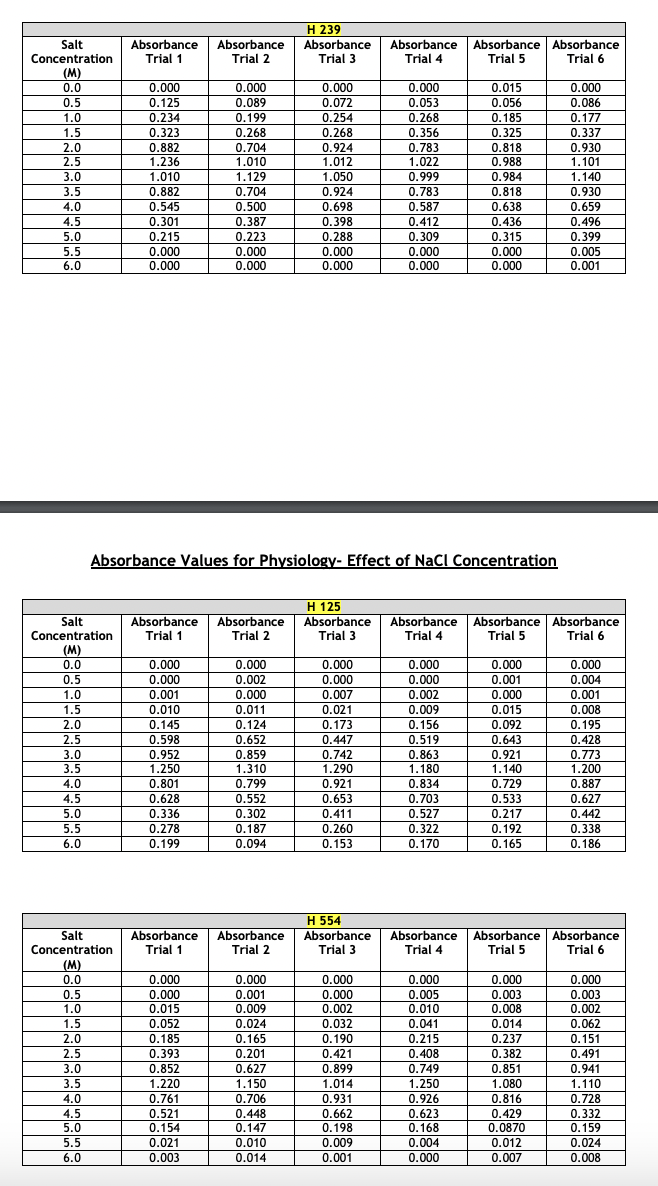
Absorbance Values for Physiology- Effect of pH The absorbance values for the haloarchaeans grown at same concentration (2.5 M) of sodium chloride (NaCl) but at different pH values are given below. The range of pH tested was 3 - 9. Turbidity was measured at 600 nm after two weeks of growth at 40C. This part of the experiment was run a total of six times. For your chosen halophiles only, present the average absorbance values and show the +/- y-axis standard deviation bars in your presentation. Choose the correct type of graph to use for the given data- histogram, scatterplot, or bar graph. Whichever type you select, the average absorbance values each of your three chosen halophiles must appear on the same graph. Absorbance Values for Physiology- Effect of NaCl Concentration The absorbance values for the haloarchaeans grown in the presence of sodium chloride (NaCl) are given below. The concentration range of salt tested was 0.0 - 6.0 M. Turbidity was measured at 600 nm after two weeks of growth at 40C. This part of the experiment was run a total of six times. For your chosen halophiles only, present the average absorbance values and show the +/- y-axis standard deviation bars in your presentation. Choose the correct type of graph to use for the given data- histogram, scatterplot, or bar graph. Whichever type you select, the average absorbance values of each of your three chosen halophiles must appear on the same graph. Absorbance Values for Physiology- Effect of NaCl Concentration The absorbance values for the haloarchaeans grown in the presence of sodium chloride (NaCl) are given below. The concentration range of salt tested was 0.0 - 6.0 M. Turbidity was measured at 600 nm after two weeks of growth at 40C. This part of the experiment was run a total of six times. For your chosen halophiles only, present the average absorbance values and show the +/- y-axis standard deviation bars in your presentation. Choose the correct type of graph to use for the given data- histogram, scatterplot, or bar graph. Whichever type you select, the average absorbance values of each of your three chosen halophiles must appear on the same graph. Absorbance Values for Physiology- Effect of Temperature The absorbance values for the haloarchaeans grown at the same concentration (2.5M) of sodium chloride (NaCl) but at different temperatures. The temperature range tested was 5 - 60C. Turbidity was measured at 600 nm after two weeks of growth. This part of the experiment was run a total of six times. For your chosen halophiles only, present the average absorbance values and show the +/- y-axis standard deviation bars in your presentation. Choose the correct type of graph to use for the given data-histogram, scatterplot, or bar graph. Whichever type you select, the average absorbance values of each of your three chosen halophiles must appear on the same graph. Absorbance Values for Physiology-Effect of Temperature Temperature Absorbance Absorbance H 239 Absorbance (C) Trial 1 Trial 2 Trial 3 Absorbance Trial 4 Absorbance Absorbance Trial 5 Trial 6 5 0.000 0.000 0.000 0.000 0.000 0.000 10 0.000 0.000 0.000 0.000 0.000 0.000 20 0.031 0.065 0.087 0.103 0.111 0.117 30 0.558 0.614 0.716 0.529 0.592 0.615 40 0.785 0.853 0.873 0.750 0.788 0.880 50 0.983 1.100 0.722 0.839 0.913 0.941 60 0.127 0.201 0.099 0.087 0.182 0.125 H 125 Temperature Absorbance Absorbance Absorbance Absorbance Absorbance Absorbance (C) Trial 1 Trial 2 Trial 3 Trial 4 Trial 5 Trial 6 5 0.001 0.000 0.002 0.000 0.000 0.000 10 0.000 0.001 0.000 0.001 0.000 0.000 20 0.010 0.008 0.004 0.018 0.026 0.019 30 0.278 0.369 0.482 0.326 0.317 0.259 40 1.120 0.956 1.030 0.949 0.887 1.020 50 0.724 0.625 0.671 0.558 0.621 0.823 60 0.337 0.201 0.148 0.215 0.117 0.284 H 554 Temperature Absorbance Absorbance Absorbance Absorbance Absorbance Absorbance (C) Trial 1 Trial 2 Trial 3 Trial 4 Trial 5 Trial 6 5 0.002 0.000 0.001 0.000 0.000 0.000 10 0.001 0.003 0.000 0.002 0.004 0.005 20 0.098 0.056 0.184 0.166 0.094 0.178 30 |g|b8| 0.851 0.741 0.795 0.852 0.881 0.671 40 0.992 0.925 1.010 1.050 1.120 1.080 50 0.661 0.559 0.510 0.418 0.747 0.549 60 0.054 0.026 0.014 0.033 0.082 0.036 pH Absorbance Absorbance H 239 Absorbance Absorbance Absorbance Absorbance Trial 1 Trial 2 Trial 3 Trial 4 Trial 5 Trial 6 3 0.000 0.000 0.000 0.000 0.000 0.000 4 0.022 0.031 0.051 0.028 0.041 0.019 5 0.084 0.073 0.063 0.074 0.113 0.055 6 0.428 0.411 0.369 0.508 0.423 0.431 7 1.020 1.030 0.994 0.930 0.986 1.042 8 0.952 0.877 0.923 0.841 0.829 0.977 9 0.488 0.475 0.367 0.328 0.271 0.434 H 125 pH Absorbance Absorbance Absorbance Absorbance Absorbance Absorbance Trial 1 Trial 2 Trial 3 Trial 4 Trial 5 Trial 6 3 0.000 0.001 0.004 0.000 0.000 0.000 4 0.018 0.005 0.017 0.001 0.002 0.000 5 0.055 0.016 0.041 0.013 0.008 0.019 6 0.370 0.221 0.217 0.335 0.127 0.209 7 1.010 1.250 0.995 1.180 0.957 1.050 8 0.922 1.100 1.020 1.030 0.891 1.010 9 0.435 0.328 0.293 0.231 0.482 0.352 H 554 PH Absorbance Absorbance Absorbance Absorbance Absorbance | Absorbance Trial 1 Trial 2 Trial 3 Trial 4 Trial 5 Trial 6 3 0.001 0.002 0.000 0.001 0.000 0.000 4 0.009 0.011 0.008 0.019 0.020 0.004 5 0.101 0.029 0.015 0.032 0.054 0.011 6 0.381 0.257 0.196 0.165 0.333 0.421 7 0.927 1.120 1.200 1.060 0.999 1.040 8 0.889 0.667 0.721 0.551 0.402 0.636 9 0.657 0.324 0.492 0.264 0.197 0.348 Salt Concentration Absorbance Absorbance H 239 Absorbance Absorbance Absorbance Absorbance Trial 1 Trial 2 Trial 3 Trial 4 Trial 5 Trial 6 (M) 0.0 0.000 0.000 0.000 0.000 0.015 0.000 0.5 0.125 0.089 0.072 0.053 0.056 0.086 1.0 0.234 0.199 0.254 0.268 0.185 0.177 1.5 0.323 0.268 0.268 0.356 0.325 0.337 2.0 0.882 0.704 0.924 0.783 0.818 0.930 2.5 1.236 1.010 1.012 1.022 0.988 1.101 3.0 1.010 1.129 1.050 0.999 0.984 1.140 3.5 0.882 0.704 0.924 0.783 0.818 0.930 4.0 0.545 0.500 0.698 0.587 0.638 0.659 4.5 0.301 0.387 0.398 0.412 0.436 0.496 5.0 0.215 0.223 0.288 0.309 0.315 0.399 5.5 0.000 0.000 0.000 0.000 0.000 0.005 6.0 0.000 0.000 0.000 0.000 0.000 0.001 Absorbance Values for Physiology- Effect of NaCl Concentration Salt Concentration Absorbance Absorbance H 125 Absorbance Trial 1 Trial 2 Trial 3 Absorbance Trial 4 Absorbance | Absorbance Trial 5 Trial 6 (M) 0.0 0.000 0.000 0.000 0.000 0.000 0.000 0.5 0.000 0.002 0.000 0.000 0.001 0.004 1.0 0.001 0.000 0.007 0.002 0.000 0.001 1.5 0.010 0.011 0.021 0.009 0.015 0.008 2.0 0.145 0.124 0.173 0.156 0.092 0.195 2.5 0.598 0.652 0.447 0.519 0.643 0.428 3.0 0.952 0.859 0.742 0.863 0.921 0.773 3.5 1.250 1.310 1.290 1.180 1.140 1.200 4.0 0.801 0.799 0.921 0.834 0.729 0.887 4.5 0.628 0.552 0.653 0.703 0.533 0.627 5.0 0.336 0.302 0.411 0.527 0.217 0.442 5.5 0.278 0.187 0.260 0.322 0.192 0.338 6.0 0.199 0.094 0.153 0.170 0.165 0.186 Salt Concentration Absorbance Trial 1 Absorbance Trial 2 H 554 Absorbance Trial 3 Absorbance Trial 4 Absorbance Trial 5 Absorbance Trial 6 (M) 0.0 0.000 0.000 0.000 0.000 0.000 0.000 0.5 0.000 0.001 0.000 0.005 0.003 0.003 1.0 0.015 0.009 0.002 0.010 0.008 0.002 1.5 0.052 0.024 0.032 0.041 0.014 0.062 2.0 0.185 0.165 0.190 0.215 0.237 0.151 2.5 0.393 0.201 0.421 0.408 0.382 0.491 3.0 0.852 0.627 0.899 0.749 0.851 0.941 3.5 1.220 1.150 1.014 1.250 1.080 1.110 4.0 0.761 0.706 0.931 0.926 0.816 0.728 4.5 0.521 0.448 0.662 0.623 0.429 0.332 5.0 0.154 0.147 0.198 0.168 0.0870 0.159 5.5 0.021 0.010 0.009 0.004 0.012 0.024 6.0 0.003 0.014 0.001 0.000 0.007 0.008
Step by Step Solution
There are 3 Steps involved in it

Get step-by-step solutions from verified subject matter experts