In as few as words as possible and using appropriate scientific expression and elements of good writing, summarize Figures 3 and 4 from the attached paper.
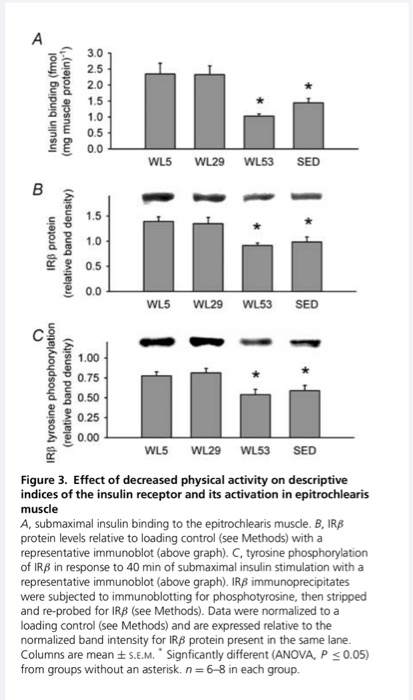
Alterations in insulin receptor signalling in the rat epitrochlearis muscle upon cessation of voluntary exercise David S. Kump' and Frank W. Booth1,2,3 'Department of Medical Pharmacology and Physiology, Department of Biomedical Sciences, and 'Dalton Cardiovascular Center, University of Missouri-Columbia, Columbia, MO 65211, USA The major purpose of this study was to elucidate mechanisms by which decreasing enhanced physical activity induces decreased insulin sensitivity in skeletal muscle. Rats with access to voluntary running wheels for 3 weeks had their wheels locked for 5 h (WL5), 29 h (WL29), or 53 h (WL53); a separate group of rats never had wheel access (sedentary, SED). Relative to WL5, submaximal insulin-stimulated 2-deoxyglucose uptake into the epitrochlearis muscle was lower in WL53 and SED. Insulin binding, insulin receptor B-subunit (IRS) protein level, sub- maximal insulin-stimulated IRB tyrosine phosphorylation, and glucose transporter-4 protein level were each lower in both WL53 and SED than in WL5 and WL29. Akt/protein kinase B Ser"73 phosphorylation was lower in WL53 and SED than in WL5. Protein levels of protein tyrosine phosphatase-1B, Src homology phosphatase-2, and protein kinase C-e did not vary among groups. The amount of protein tyrosine phosphatase-1B, Src homology phosphatase-2, and protein kinase C-associated with IRS in insulin-stimulated muscle also did not differ among the four groups. The mean of SED and WL53 had a significantly higher IR, 3-associated protein tyrosine phosphatase-1B than the mean of WL5 and WL29. The enclosure of multiple changes (decreases in insulin binding, IRS protein, IR 3 tyrosine phosphorylation, and glucose transporter-4 protein) in the epitrochlearis muscle within the 29th to 53rd hour after cessation of voluntary wheel running raises the possibility that a single regulatory event could be responsible for the coordinated decrease. (Received 9 August 2004; accepted after revision 17 November 2004; first published online 18 November 2004) Corresponding author E W. Booth: Department of Biomedical Sciences, University of Missouri-Columbia, E102 Veterinary Medical Building, 1600 East Rollins Road, Columbia, MO 65211, USA. Email: boothf@missouri.edu There is a strong relationship between physical inactivity and insulin resistance (Kriska et al. 1993; Mayer-Davis et al. 1998; Gustat et al. 2002). This is supported by observations that insulin sensitivity falls off within days when physically active humans become sedentary, with the decreased physical activity decreasing insulin-mediated glucose uptake. For example, the area under the insulin curve during an oral glucose tolerance test increased 73, 30, or 93% when endurance-trained individuals did not exercise for 7-10, 14, or 10 days, respectively (Heath et al. 1983; Houmard et al. 1993; Arciero et al. 1998). Measured by submaximal hyperinsulinaemic, euglycaemic clamp techniques, glucose disposal rate decreased 23% after 10 days of no exercise in physically trained subjects (King et al. 1988), and the insulin concentration required for 50% of maximal glucose uptake increased 23% after 5 days of decreased physical activity in endurance-trained subjects (Mikines et al. 1989). Thus, it is clear that insulin sensitivity declines within days of decreasing physical activity in humans. However, little is known about the cellular basis for the effect. S keletal muscle accounts for 75-95% of insulin-stimulated glucose disposal in humans (Baron et al. 1988). We have shown that insulin resistance develops in the mouse soleus muscle after 1 day of hindlimb immobilization (Seider et al. 1982). Other studies have shown that following swim-training, insulin-stimulated glucose uptake into the isolated rat epitrochlearis muscle decreases to sedentary levels 40-90 h following the last swimming bout (Kawanaka et al. 1997; Host et al. 1998a; Reynolds et al. 2000). Taken together, the above reports suggest that skeletal muscle could be the source of the physical inactivity-induced decline in whole-body, insulin-stimulated glucose disposal in humans. To gain a better understanding of the mechanisms by which decreased physical activity decreases insulin-stimulated glucose uptake, we wanted to employ an animal model that would mimick what happens when previously active subjects stop exercising. The use of voluntary running wheels more closely approximates the manner in which humans have historically engaged 0 S. Kump and F. W. Eccth A : tractivity inducec reduction in signaling at the insulin receptor Biotechnology. Glucose transporter-1 (GLUT11 poly- clonal antibody was from Biogenesis Horseradish peroxidase HRP-linked arti mouse and anti-rabbit exondary antibodies BK HRP-linked prolin were from Amersham Vectastain ABC kit was from Vector Laboratories. All other chemicals were from Sigma. they were killed. when food was removed at 04.00 h. At 114.00 h, the animals were anaesthetized with all my pertobarbital (kg body mass!-!. Epitrochlearis muscles were carefully dissold out, rinsed in predaunated Krehs Henseleit buffer (KHB: 116 mm Nach, 4.10 MM KCL.16 m. KHIN 25.3 MM NHCO., 25m CC 1.16 MM MASC. PH 7.4) 40 mm mannitol. and used for experiments escribed below The animals were exsanguinated by removal of the heart. in physical activity in that als both cat and engage in voluntary physical activity on an intermittent hesis during their waking nocturnal hours (Rodnick er al. 1989). This enables the animals to be studied during time when they are normally sleeping, not physically active, and not eating Rodaick et al 1989; Moruska & Fleshna, 2001). In addition, we chose to study rals in posipr ial state, rather than in a fasted sale, as this. in our cpinion, represents the more common condition in modern humans. Locking the running wheels so that theanimals cannat run facilitates the study of events that accur with decreased physical activity (Tsai erai. 1981). One purpose of this study was to determine the line course of decline in glucose uptake into the epitrochlearis muscle with a return to normal cage activity following 3 weeks of voluntary wheel running. Based on these results, we nestlypothesixallalanduction in sures of insulin receptor signalling would first occur at either 29 or 53 h after locking the running wheels. A major finding of this study wA4 that the inwulin Fear M-subunit TERS) protein level and the essential components of insulin receptor activation, insulin binding and yousine phospborylatior, decreased to sedentary levels in the rat epitrochlearis muscle T een 29 and 5315 after cessation of voluntary running activity following 3 weeks OL Yuniary wheel running muscles were transferred to KHB-0.1% BSA-40 mm mannitol containing labelled insulin (0.12 cml' The right epitrochlearis muscles were exposed to 0.4 insulin and the contralateral left muscles were incubated with 7.5 H insulin. During these steps, the muscles were kept in stegpered vials under a constant scream of 95% ), -9 CD in shaking water bath at forum 37 CThe Ducks were the washed 8 tips for Smin each in 5 ml of ice-cold KHB 0.1%. ASA 40 mm mannitol, dissolved in IN NaOH and neutralized with 2N HC. Aliquats were counted in duplicate on a gamma counter. Non specific hinding was determined Iron anal inculated with 7.5 insulin and sul tracted from the contralateral muscle to obtain values for specific insulin binding. Non-specific binding did not differ between groups (data not shown). An aliquot of the dissolved husde was used for determining protein concentration using the Bradfond method (Bradford. 1976). Immunoblots and immunoprecipitations The animal protocol was approved by the Institutional Animal Care and Use Committee at the University of Missouri-Coluanbin Fischer 34-4 x Brown Norway FL hybrid mats (Harlan were obtained at ape 21-23 days and allowal to acclimative for 1 week. The animals were housed in approved temperature controlled animal quarters with a 01.00-15.00 ha lihat: 1600-010b dark cwcle that was maintained throughout the experimental period. After I wees Iday 09, the rats were randomly assigned to one of our n as fallew ballocks (W1.5), wheel lod: 29 W29, or wheel lock 5 (W1.53), representing 3 weeks at volur:tary wbeel access followed by 5, 29, or 53h of wheel lock that prevented access to voluntary running ospolicy, or SED. procita sedentary group without running wheel access for the entire 3 weeks Fig. 1). At this time the animals were separated into individual capes of the ame dimensions: Cages for animals in the ruling groups WLS WL29, WI.53) were equipped with a voluntary running wheel outfitted with a Sigma Sport BC 30 bicycle computer (Cherry Creek Cydery, Master Hall, VA, USA for measuring rumning activity. After 3 weeks for day 211, the wheels were locked for all running groups al 04.00 l SED and 1.5 animals were killed at 119.00 h. The W 29 group remained in their cages with locked wheels before being lulled the following day ar day 221 at 09.00 h after 29 11 ol wlect lock and W153 retined in Leir cages with lacked wheels until day 23 when they were killed at 09.00 h after 53 h of wheel local. The animals bad as Ni cce to fad at all time until the davan which C Methods Materials 2.11,2 SIIN)Decxyglucose and LMCmannitol were Iron American Radiolabeled Chemicals 121-labelled insulin was from New England Nuclear. IR paly- clonal, phosphoryraside maracanal. protein troine phosphatase 13 PTPIB) monoclonal, protein kinaseCe IPKC-5) Monoclonal and Snc lorbology phosphala- 2 ISHP2) monoclonal antibodies were from BD Biosciences Re, Akt und akt Se phospho-specific polyclonal ant bedies and protein Aars were from Upstate 2-Deoxyglucose uptake 2-Deaglucose (2-DNOG) uptake was performed essentially as described (Hakama . 1997) with minor modifications. Triefly, muscles were preincubated in KHB-0.1% bovine serum albumin (BSA-38 mm mannital-2mm sodium Acetate for samin. The muscles were then transferred to the same solution either without insulin basal), or with 60 ml (sumasin, 0,4M or 2 mu ml-Imaximal, 12.9 insulin for 10 min. In all cases, the left epitrochlearis muscle was incubated without insulin and the contralateral right muscle was incubated with either sulmaximal or axirs ilin, The nuk were rinsed by incubation in KH -01.1% BSA-40 mm manitolith or without ir sulinor Omir. The muscles were then incubated in KH-0.11% HSA-18 mm mannitol (0.2cm -2 2-CARY (1.5 Cil) for 20 min after which they were blotted dry ouer ice on filter paper pre-wetted with incubation medium, rapidly cut Crosswise inta Iwonics (1/and 2/3 of the muscle size placed in aluminium foil, and frozen in liquid nitrogen. During all incubation seps, the muscles were kept in stopped vials under a constant stream of 95% 0.-59 CO, in 17 baling water bath at 60.p.m. For determination of 2 DOG uptake, measurement of radiolabel in the musck was performed as described by Hansen er al. (1994) using mannitol to determine the extracellular space. Brietly, the approximately 1/3 sextion of the muscle was weighed, bailed in 1 ml of water for 10 min, cooled on ice for 10 min, and centrifuged to remove the non-soluble material. Aliquos of the supematant were counted in duplicate on a scintillation counter with preprogrammed windows for dual scintillation counting of 'H and C. As hasal 2-DOG uptake did not ditter within groups when the contralateral muscle was used for either submaximal or maximal 2 DOG uptake (data not shown), the results are combined for presentation of the data Imunoanalysis was performed on the remaining 2/3 ot the epitrodilearis muscles from animals where the right I scle was incubated with subramal ir sulin. The left hlaris mudes, which were incubated without insulin, were bomogenized in 15 mig hechogenization huffer my Hepes, pH 7.4, 4 MM EXCTA. 10 m N, EDTA, 15 mm Na, 0, 100 mu glycerophosphate, 25 MM NAF 198 lucpal CA670,5 min activatal Na, Songmi-'each of leupeptin, pescarin, and protinin rolated cod-over-end at 40 foc l l. centrifuged at 16 00g at 4C for 30 min, and the supernatant frozen in aliquots at -80C folincing a Bradford assay for protein determination Bradford, 1976). These samples were used for immunoblot analysis and citrate synthase activity as described below. The right irrachlearis muscles (incubated with subemaximal insulin) were treated in the same Dant. copt that they were homogenized in immunoprecipitation buffer (50 m "Tris-HC H182 150 MM NICI I AM Na EDTA, I my EGTA, 1'. Tritan X-100, 11.25 de xeychelic acid, 15 lauryl sullabelix, 0.2516 VI willabetains, 057% 3-1l-pyridina)-1.propanesubphonate, 2.5 mm activated Na,VO, 2.5 m p henylmethanesulphonyl fluoride 25 g ml-reach of leupeptin, p ain, and protinin these samples were used for immunoprecipitation Experiments anderled clo For immunoblot analysis 2040 of homogenate protein from the left muscles was subjected to sodium dodecyl sulphate palyacrylamide gel electrophoresis and transferred to atrocellulose membrane. The membranes were stained with Ponceau-S to verify equal loading and blocked for 1 h. Following an avemight incubation with primary antibodies at 4C, the membranes were weeshoushola access to VW + S u ming wheels locked Experiment groups SED NO VAW access, no running WLS 3 week verary running. 5 hours lock WL29. 3 weke voluntary running 20 hours wwel lock Figure 1. Experimental design Hath of the Ch ild corespond ine the other. Sas Irollo c on VW tym nawel - 24 animals to d e ntalgro.p. Insulin binding Insulin binding experiments were performed essentially as described ile Marchand-Brustel & Freychet, 1978. Honen et al. 1986). Epitrochlearis muscles were preincubated in KH-0.1% HSA-40 m mannitol. After 15 min, the WL53. 3 weeks voluntary running, 5 hours who lock T UCK SO 2304 The data 2004 U S. Kump and F. W. Eccth tractivity inducec reduction in signaling at the insulin receptor Glycogen concentration The approximately 23 sections of the left citrochlearis muscles incubated without insulir from animals where the right muscle was incubated with c licsulin were used for determination of glycogen concentration using the throne metod (Hassid & Abrabum, 1957). Briefly, fruxen muscle samples were dissolved in SM KOH, and glagen 3 pximitated wilt banal, 1 planen precipitate was then hydrolysed by boiling in SN HCl for Lit peutralized with 5N NOU, and an aliquot u simple was boiled in 93. Hx).-0.1 anthrane for 15 min. The concentration of glucosyl units was then determined ainst suose sandards in a spectropholcandlet al to WL5 (1.166 + 0,0901 W 29 (1.0270.1391 was submaximal insulin-stimulated IRA tyrosine intermediate between, but at different from, W 3 phasparylation was decreased lyr 90and 27 in and WL53. SED 10.7610079) was also lower thanW 1.53 compared to WL5 and W129, respectively, and WL5 and not different from WL53 (see Fig1 for group 24 and 27% lower in SED than in ILS and descripcions. Thus, submaximal 2-DOG uptake dedined W1.29, respectively (Fig.3C). Thus, three descriptive from WL5 values to SED values atter 53 b of wheel lock. indices of the insulin receptor insulin binding. IRA For subsequent immunoanalyses, only muscle from procen, and IRA tyrosine phosphorylation) showed animals ullor the subsial insulin operations identical treatment pallcens. being unchanged from was assured as this was the only insulin treatment W15 to W.29, and decreasing in W1.53 to SED producing significant differences levels. Insulin binding, insulin receptor protein level and insulin receptor tyrosine phosphorylation PTP1B, SHP2 and PKC To obtain information on patential factors producing the change in IRA tyrosine phosphorylation levels of three proteins (PTPLE, SIIP2 and PKC B) that can negatively regulale IRB Tyrosine phosphorylation were measured in wasbed, incubated with secondary antibody for lb. washed again, tretai with an enhancedchemiluminescent reagent, and exposed to film for visualization of the protein, Prolcir lands were quantityd using a car densitometer Molecular Dynamics. Optimal blocking conditions, primary antibody dilutions and conditions, washing praial and respect, and secondary antibody D ralian ar tisans wisted Til sturally for each protein asserved. All goals were loaded with an equal amount of a leading control which was used for normalization of data hereen blats. The landing control for PTPL RWas SWI3 cell extract; the loadingcontrol for all other antibodies w homogel olan insulin-linulated epitrochloris muscle from a non-experimental rac Immunoblots for Akt and Ast Ser phosphorylation were performed on muscles stimulated with submaximal insulin and homogena in immunoprecipitation huffer. For immunoprecipitationa lis 500 49 of homagnate protein from muscles irxubated with submaximal insulin was rotated end over end awernight at 4C with 5 of polyclonal anti-IRA antibely volume of 100 l ut a 50 protein A agarose bead slurry was added and the samples were old end-aw-end at 4C for 2 h, after which the beads were washed and boiled in 60 xlosmanple butter Saanples were anded on a geland subiected to immurablet analysis for phosphotyrosine or IR using monoclonal antibodies as described above. The membranes were then stripped using Re Blot Plas Mild IChemicun according to the manutacturer's instructions and re-arbed for IR PIPIR SHP2, ar PKK indicated in the figure legends. Quantification of each blut with IR 8 im Doppilaleis U d relative to the amount of RA detected in the same lane on the blot and normalized to the loading control. As a restive control an equivalent amount of submaximal insulina imate Ituck was also subicid to the immunoprecipitation protocol using 5 kg of rabbit immunoglobulin G in place ot anti-IR antibody 2 Statistics Groups were compared using analysis of variance (ANOVA), and the Sudent-Ncuran Keuls loox was used to determine which groups were different. Total running distance, running distance during the thind week and on day 21, initial and final body mass.total food intake, and food intake on the right for the animals were killed were eich considered and eliminated as possible coriates for 2-DOG uplake Experiments involving PTP13. SHP2 and PRC were also analysed tising ANOVA with 1 o rasla cekati Nelerdiol 1996 compare of W1S and WL 29 to the mean of WL.) and SED. Since an analysis of residuals owed some extreme values the were verified in the non-ramatic Wilawan ranksum test. A one sided alternative was used for both the coasts and the rants sur le Significance for all tesis we defined at P 00). All data are presented S.L.M. Statistics were performed using either SmaStar Seat Software, Inc., Paint Richmond, CA, USA) or SAS (SAS Institute In Cary, NC, USA). A change in submaximal response with no change in maximal res has been interpreted ta suprest that there are alterations at the receptor level Kahn, 1978; Goal. 2001| As the results for 2-1OXG lake demonstrate this pattern, the next studies were directed toward the insulin receptor Srecific insulin binding (Emal Img total protein ) at submaximal insulin in the epitrochlearis musck was lower in WLS (1.027 +0,069 compared to both WIS and W1.29 (2.146 +0.136 and 2.324 + 1279, respectively. Fin. M), W1.53 and SFI) (1.446 +0.137) were not different. IRA protein level in WL53 was decreased by 31% and 32% compared to WLS and W1.29, respectively, and was 29% and 22 lower in SED than in WL5 and W1.29, respectively (Fig. 35). Relative to the amount of IRR on the same blot WL29 WL53 SED relative und density) WLS SED 2-Deoxyglucose uptake jumal mit 120 min WLS WL29 WLS3 SED 8 Figure 3. Effect of decreased physical activity on descriptive indice of the insulin receptor and its activation in mitochlearis Results 2-Deoxyglucose uptake 2-Decxyglucose 12-DOG) is a glucu analogue whose uptake into isolated skeletal muscle preparations has e NOWIL lo accurately stiute gouse pak (Hansen er al. 1994). 2-DOG uptake into the isolated epitruchleuris muscle in vitro as measured either without insulin (hasal, or in the presence of a submaximally AU ml-') or maximally 12 ml ml stimulating insulin concentration. Basil 2-TOG uplas did not diller among the four treatment groups, indicating that the postexercise increase in tasal 2-DOG uptake had dissipated Richter, 1995). Maximal insulin stimulated 2-DOG plake was also nol Jilement among the groups (Fig. 2)Submaximal 2-3CX upcake ( 2-DOGiml intracellular space) - (20 min)-') in W1.53 (0.740+ 1.093) was significantly lower relative Citrate synthase activity Filly micrograms of musck bucionale from samples incubated without insulin were need for determination of citrate synthase activity Srere, 1969). Bretly, samples were diluadinta a final walume of 40 of 100 mM KID, PO - 100 MM KUPO.pl 7.4 50 AN EGTA-50AN NA EDTA and kept online. Duplical samples of 101 and 200 mich were mixed into a final volume of 900 l of 100 mm Tris, pH 80-0.167 na acetyl coenzyme A-oillmm 5 dithiobis 2 nitrobenzoic acid and placed in a 30 C waler kul for 5 min. Oxalancetic acid, 1001 at a concentration of Smar, was immediately added and the reaction measured in a spectrophotometer at 412 om formins. O Figure 2. Etfect of physical activity on 2-DOG uptake into isolated epitrocharis muscle under bawl (no added insulin P submaximal irulin-stimulated (50 ml), and maximal insulin-stimulated 6 m m sonditinn Grow lockrilor Sh15, 20h WL2913 (1153 A New.lining to the whole chenleistet wing control ishociwth a rimchila r in hyheron CIHAH 40 Meld un with Pinot NATITIRISH Swimmi che hans deling Gow n within the Sementation LANGVA, 03. 15-16 inch and 7-B in each group for both insulin concentrations inpulin up luar bal Oldtimer A rithm 10 Cum samaM'SyriandiANOVA P S 0.05 from oups without antik-6 inch group OTC Sory 2304 The de 2004 PTP1B protein (relative band intensity) WL5 WL29 WL53 SED SHP2 protein (relative band intensity) 1.00 0.75 0.50 0.25 0.00 homogenates and in IRB immunoprecipitates (Rocchi et al. 1996; Elchebly et al. 1999; Strack et al. 2000; Ouwens et al. 2001; Zabolotny et al. 2004). The pre-hoc hypothesis was that the level of each of these proteins and their association with IRB upon submaximal insulin stimulation would show an inverse pattern of changes compared to the pattern of changes in IRB tyrosine phosphorylation observed in the earlier part of the present study, i.e. in comparison to Fig. 3C where WL53 and SED were lower than WL5 and WL29 for IRB tyrosine phosphorylation, WL53 and SED would be higher than WL5 and WL29 for PTP1B, SHP2 and PKC-e. Total protein level for PTP1B and PKC-o did not differ between groups (Fig. 4A and C), while the SHP2 protein level was 23% lower in WL53 than SED (Fig. 4B). The amount of PTP1B, SHP2, or PKC-associated with IRB, expressed per unit of IRB on the same blot, was also not different between groups (P = 0.07 for PTP1B; Fig. 5). Because it had been hypothesized a priori that both WL53 and SED would each be greater than either WL5 or WL29, we further tested this hypothesis using ANOVA with a contrast statement (Neter et al. 1996). When this method was employed, it was found that the mean of SED and WL53 had a significantly higher IRB-associated PTP1B than the mean of WL5 and WL29 (Fig. 5B, inset); PTP1B, SHP2 and PKC-total protein levels (data not shown) and IRB-associated SHP2 and PKC-6 were not significantly different (Fig. 5C and D, insets). These results were confirmed using the Wilcoxon rank sum test. WL5 WL29 WL53 SED PKCO protein (relative band intensity) 0.25 0.00 WL5 WL29 WL53 SED Figure 4. Effect of decreased physical activity on negative regulators of insulin receptor activation in epitrochlearis muscle PTP1B (A), SHP2 (B) and PKC-(Cprotein levels normalized to a loading control (see Methods) with representative immunoblots (above graphs). Columns are mean S.E.M. Significantly different from WL53 (ANOVA, P