

Question: According to following data, design a control chart and determine process is in or out-of-control. Time 1 2 3 4 5 6 7 Average of
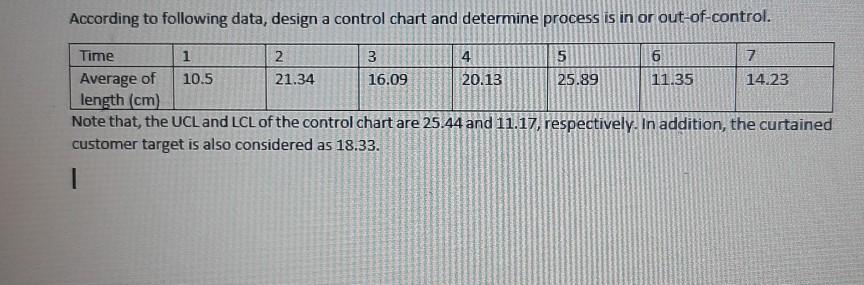
According to following data, design a control chart and determine process is in or out-of-control. Time 1 2 3 4 5 6 7 Average of 10.5 21.34 16.09 20.13 25.89 11.35 14.23 length (cm) Note that, the UCL and LCL of the control chart are 25.44 and 11.17, respectively. In addition, the curtained customer target is also considered as 18.33. 1
Step by Step Solution
There are 3 Steps involved in it
1 Expert Approved Answer
Step: 1 Unlock

Question Has Been Solved by an Expert!
Get step-by-step solutions from verified subject matter experts
Step: 2 Unlock
Step: 3 Unlock