

Question: According to the Mimic Analytics Round 6-7 - clearly addresses what you learned about two of the following learning objectives from the round of the
According to the Mimic Analytics Round 6-7
- clearly addresses what you learned abouttwoof the following learning objectives from the round of the simulation you played.
Learning Objectives
? Demonstrate an understanding of the processes and techniques of marketing data collection, analysis, and visualization. ? Explain and apply the logic of optimization and attribution in marketing analytics. ? Explain the terminology and tools of marketing analytics. ? Apply the practical tools and techniques of marketing analytics. ? Understand the roles of data technologies, data management systems, and data visualization in marketing. ? Study and practice programming tools and structured query language. ? Engage in social listening and content analysis. ? Understand artificial intelligence, machine learning, and deep learning. ? Run field experiments in digital environments, including A/B testing. ? Understand marketing mix models.
Carefully read the rubric below for assessment of this brief.
Round 6
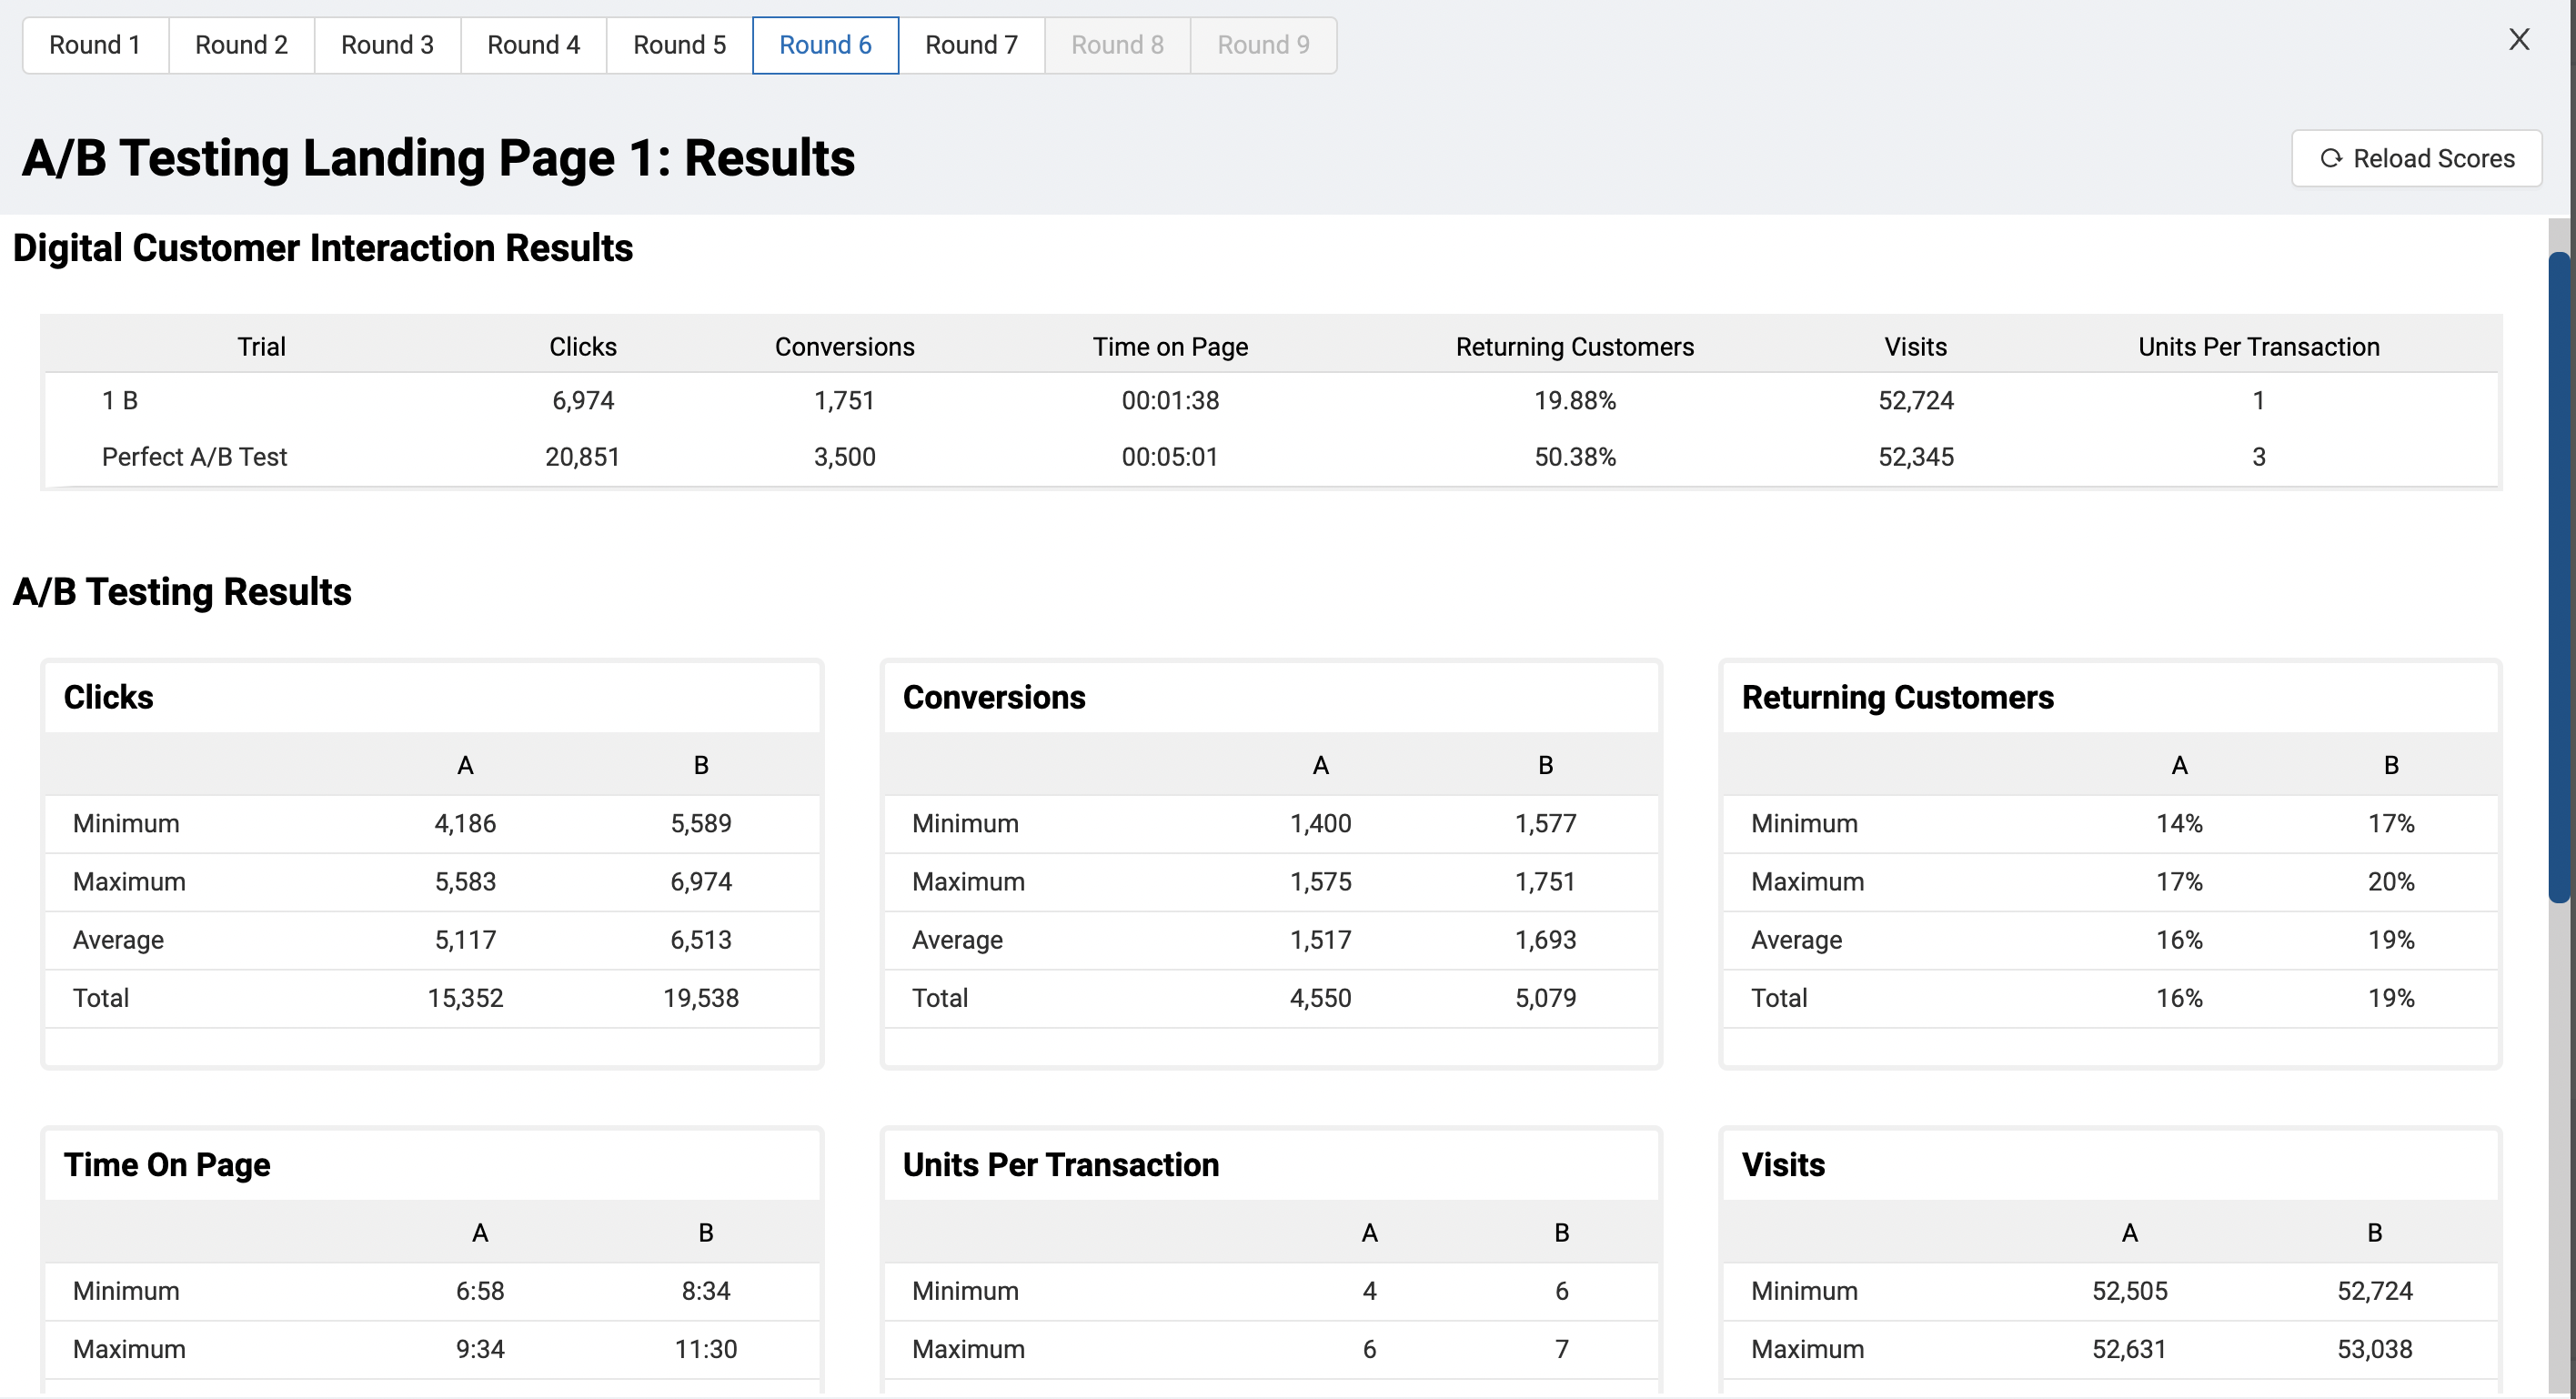
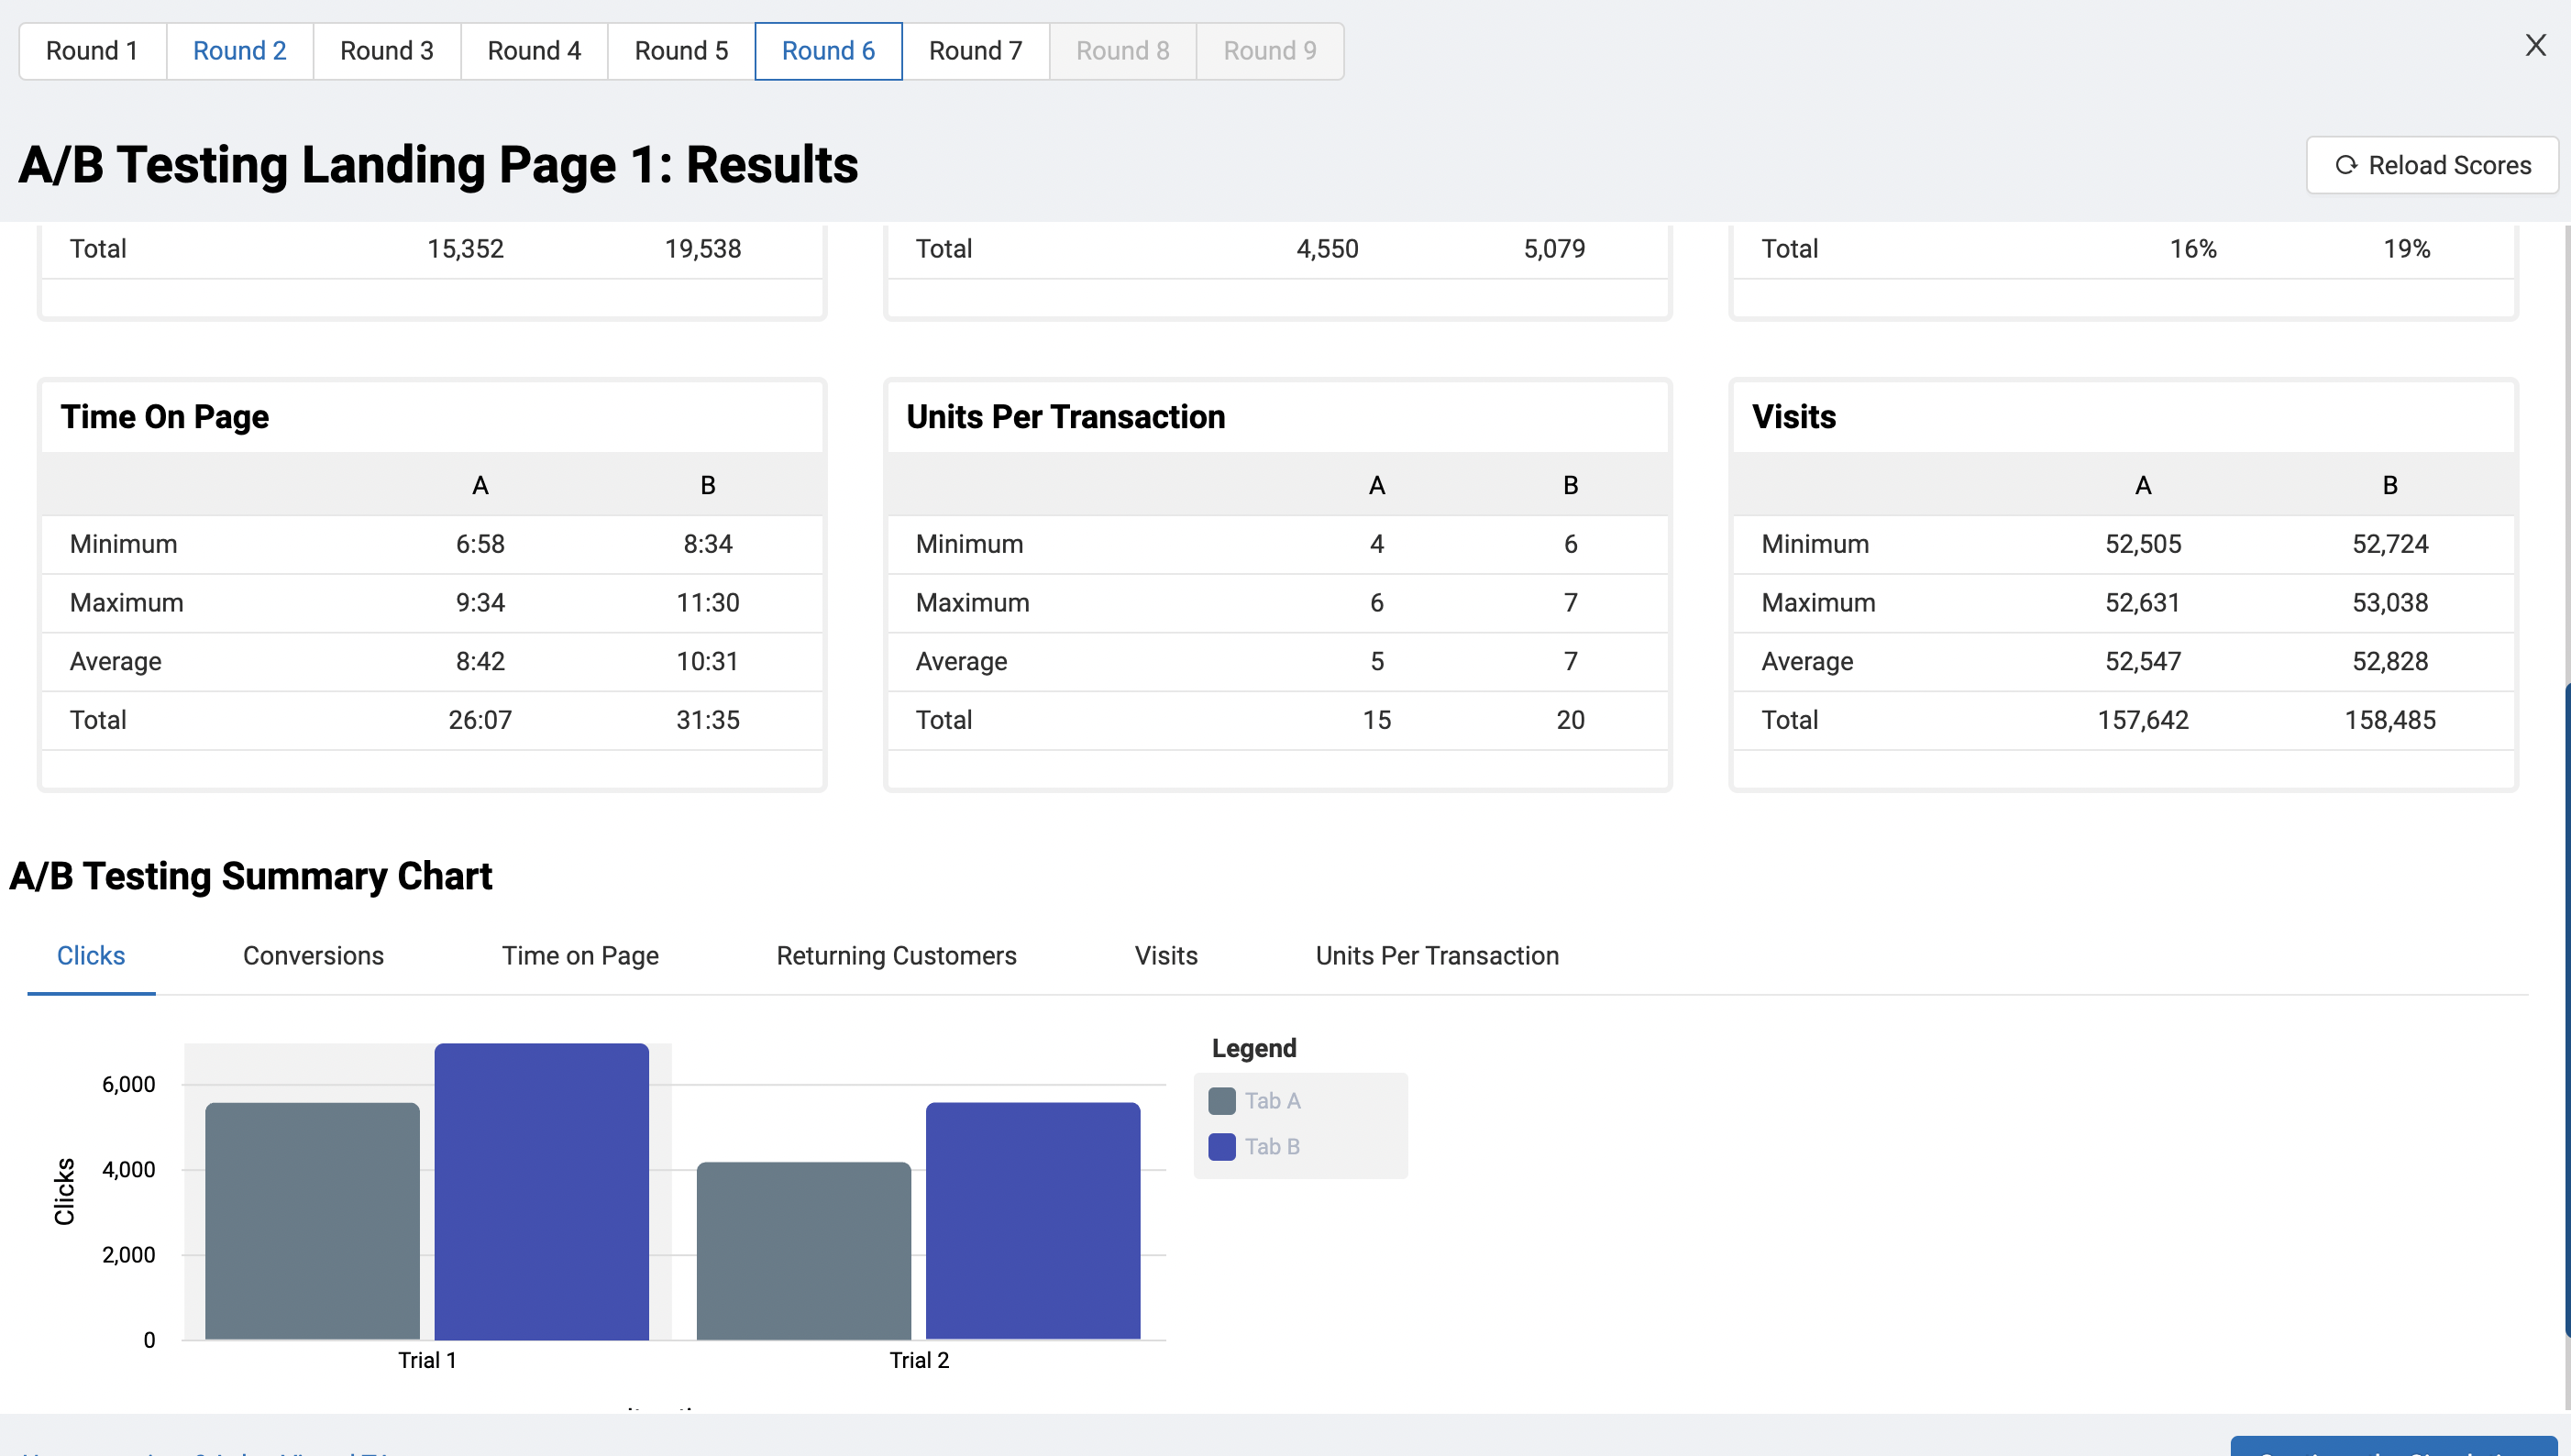
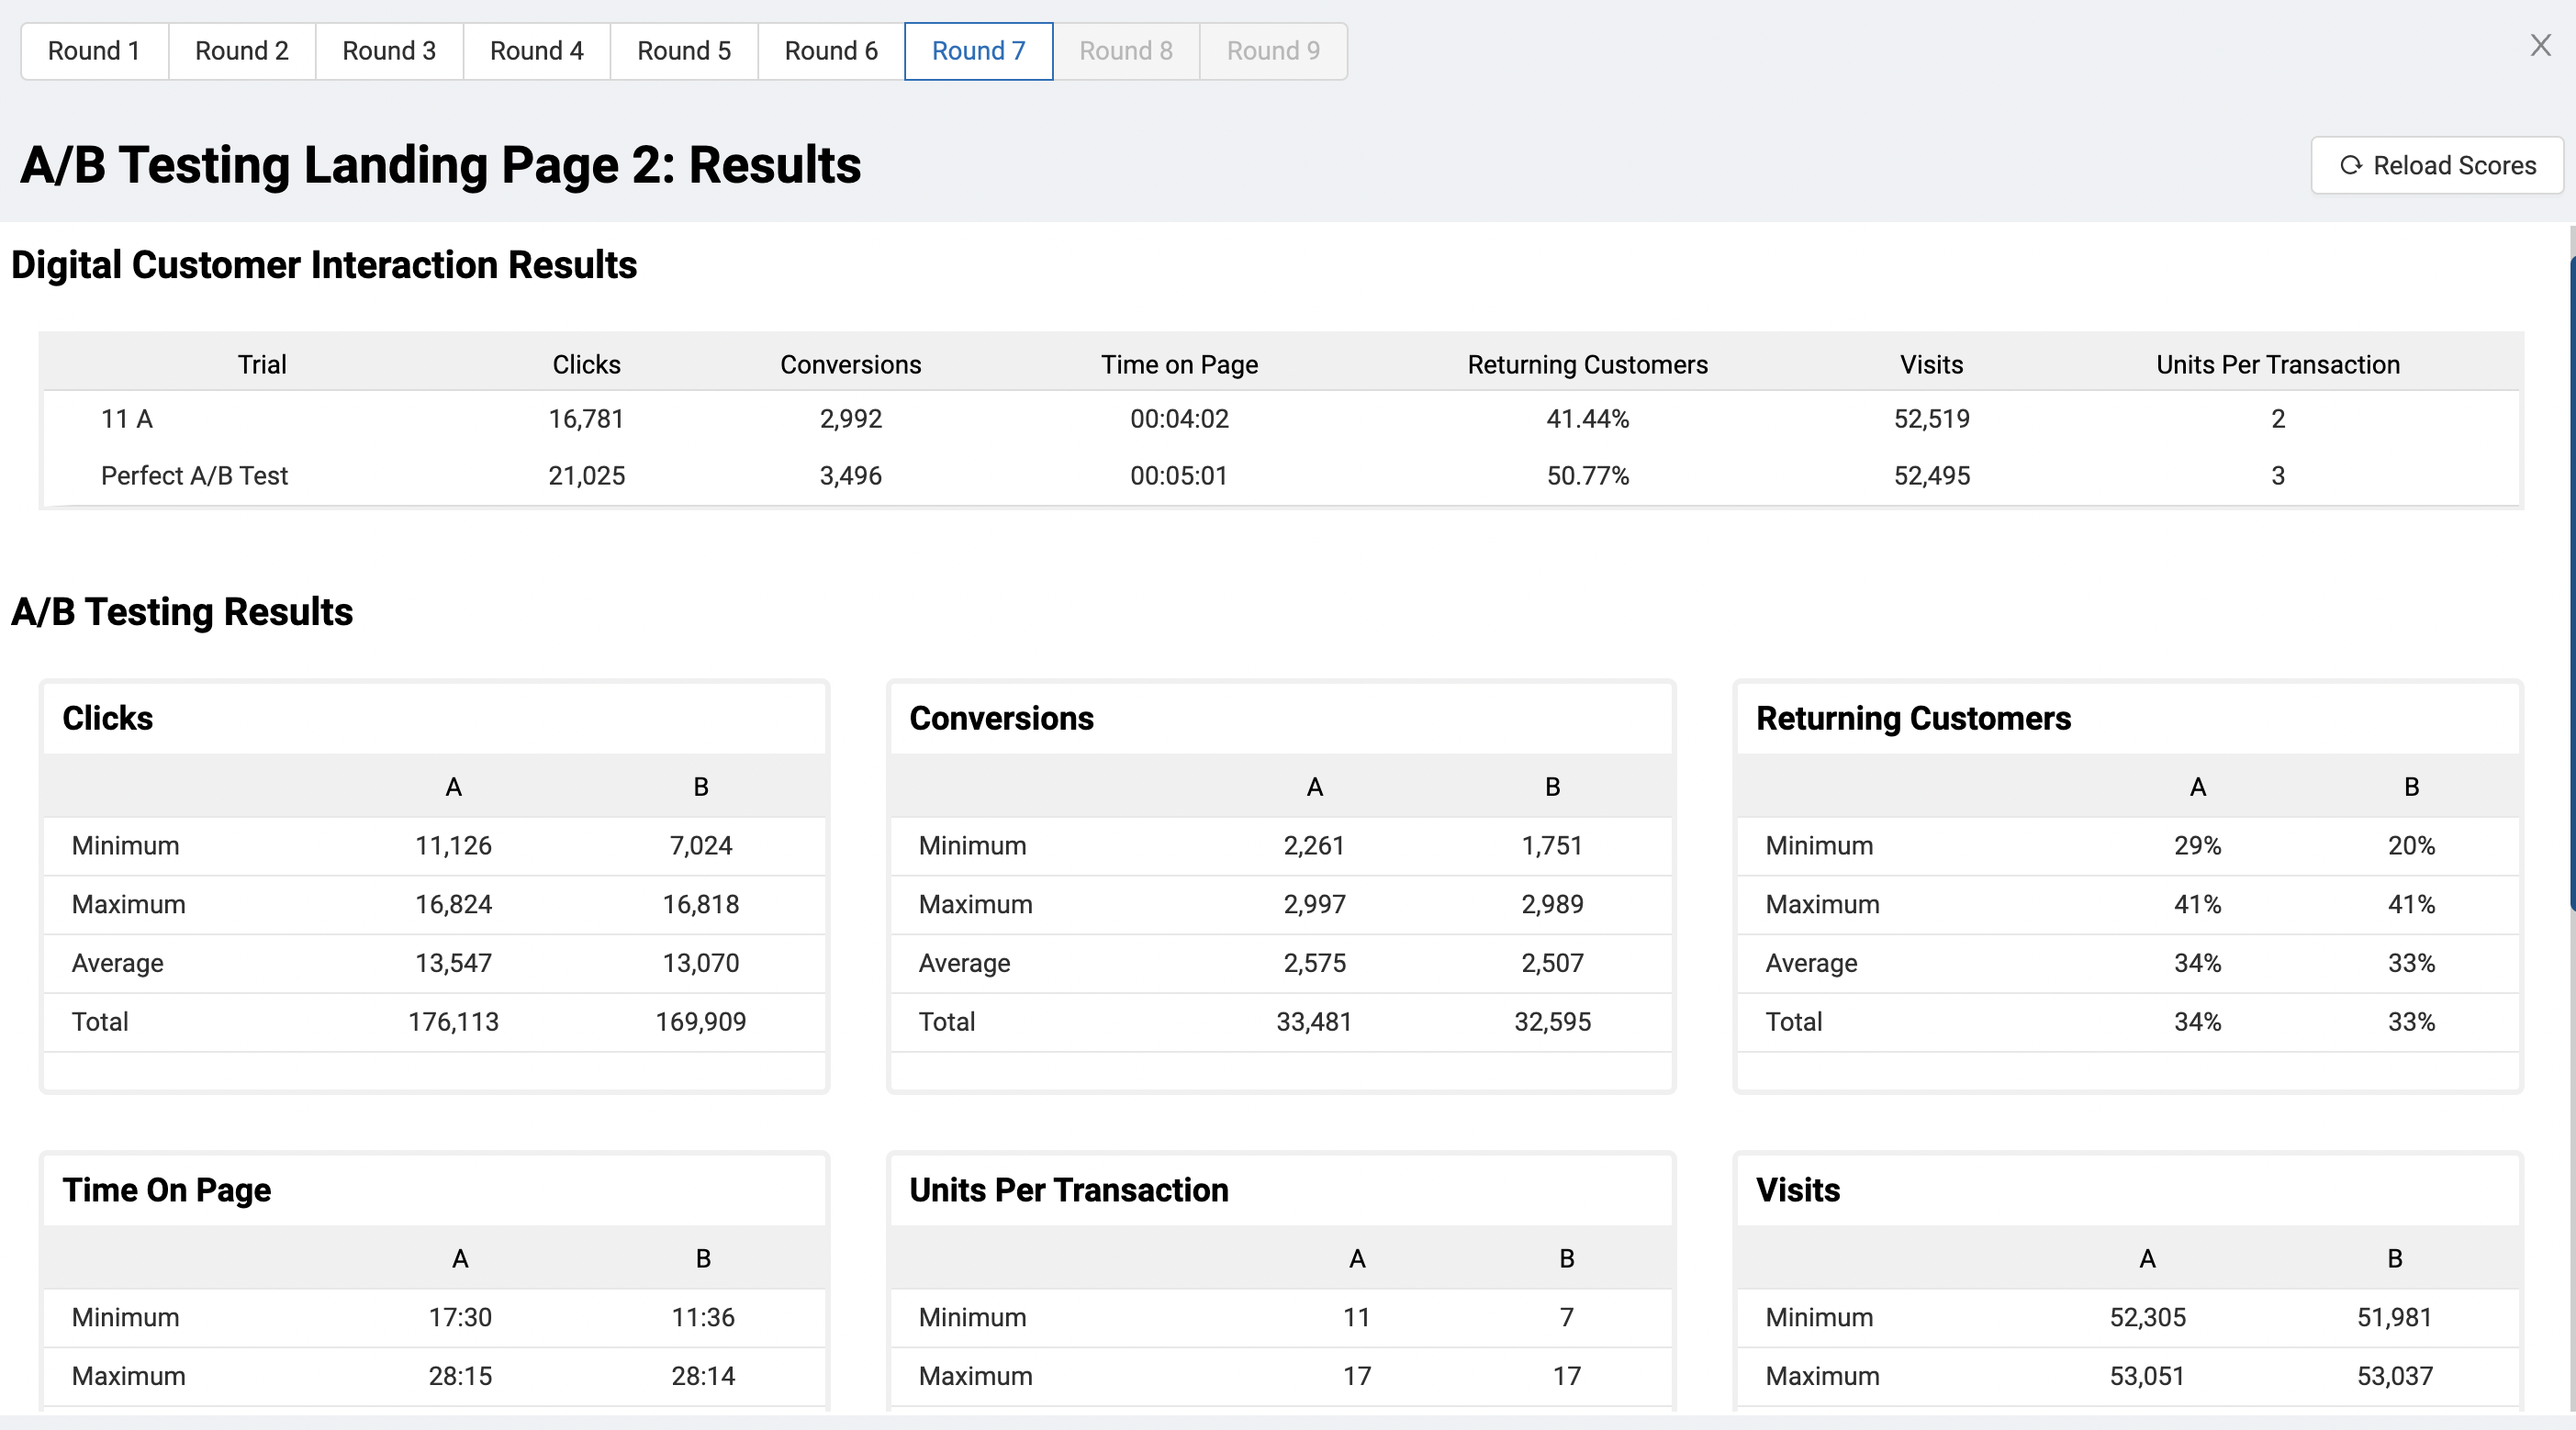

Round 1 Round 2 Round 3 Round 4 Round 5 A/B Testing Landing Page 1: Results Digital Customer Interaction Results Trial 1 B Perfect A/ B Test AlB Testing Results Clicks Minimum Maximum Average Total Time On Page Minimum Maximum 4,186 5,583 5,117 1 5,3 52 6:58 9:34 Clicks 6,974 20,851 5,589 6,974 6,513 19,538 8:34 11:30 Round 6 Round 7 Conversions 1,751 3,500 Conversions Minimum Maximum Average Total Time on Page 00:01:38 00:05:01 1,400 1,575 1,517 4,550 Units Per Transaction Minimum Maximum Returning Customers 19.88% 50.38% 1,577 1,751 1,693 5,079 Visits 52,724 52,345 Returning Customers Minimum Maximum Average Total Visits Minimum Maximum 0 Reload Scores Units Per Transaction 1 3 A B 14\".: 17% 17% 20% 16% 19% 16% 19% A B 52,505 52,724 52,631 53,038 Round 1 Round 2 Round 3 Round 4 Round 5 Round 6 Round 7 . . A/B Testing Landing Page 1 : Results Total 15,352 19,538 Total 4,550 5,079 Time On Page Units Per Transaction A B A B Minimum 6:58 8:34 Minimum 4 6 Maximum 9:34 11:30 Maximum 6 7 Average 8:42 10:31 Average 5 7 Total 26:07 31 :35 Total 15 20 NB Testing Summary Chart Clicks Conversions Time on Page Returning Customers Visits Units Per Transaction 6,000 4,000 Clicks 2,000 Trial 1 Trial 2 Legend Total Visits Minimum Maximum Average Total 16% A 52,505 52,631 52,547 1 57.642 0 Reload Scores 19% B 52,724 53,038 52,828 158,485 Round 1 Round 2 Round 3 Round 4 Round 5 Round 6 Round 7 A/B Testing Landing Page 2: Results Digital Customer Interaction Results Trial 11 A Perfect A/ B Test A/B Testing Results Clicks Minimum Maximum Average Total Time On Page Minimum Maximum A 11,126 16,824 13,547 176,113 17:30 28:15 Clicks 16,781 21,025 B 7,024 16,818 13,070 169,909 11:36 28:14 Conversions 2,992 3,496 Conversions Minimum Maximum Average Total Time on Page 00:04:02 00:05:01 2,261 2,997 2,575 33,481 Units Per Transaction Minimum Maximum 11 17 Returning Customers 41 .44% 50.77% 1,751 2,989 2,507 32,595 17 Visits 52,519 52,49 5 Returning Customers Minimum Maximum Average Total Visits Minimum Maximum 0 Reload Scores Units Per Transaction 2 3 A B 29% 20% 41 % 41 % 34% 33% 34% 33% A B 52,305 51,981 53,051 53,037 Round 3 Round 4 X Round 1 Round 2 Round 5 Round 6 Round 7 Round 8 Round 9 A/B Testing Landing Page 2: Results Reload Scores Time On Page Units Per Transaction Visits A B A B A B Minimum 17:30 11:36 Minimum 11 7 Minimum 52,305 51,981 Maximum 28:15 28:14 Maximum 17 17 Maximum 53,051 53,037 Average 22:23 21:38 Average 14 13 Average 52,584 52,452 Total 4:51:00 4:41:24 Total 176 169 Total 683,593 681,874 A/B Testing Summary Chart Clicks Conversions Time on Page Returning Customers Visits Units Per Transaction Legend 15,000 Tab A Tab B 10,000 Clicks 5,000 Trial 1 Trial 2 Trial 3 Trial 4 Trial 5 Trial 6 Trial 7 Trial 8 Trial 9 Trial 10 Trial 11 Trial 12 Iteration
Step by Step Solution
There are 3 Steps involved in it

Get step-by-step solutions from verified subject matter experts