

Question: 2. Continue to use the data set from problem 1. a) Obtain numeric values for the following quantities. i. SSTO ii. SSR (X) iii.
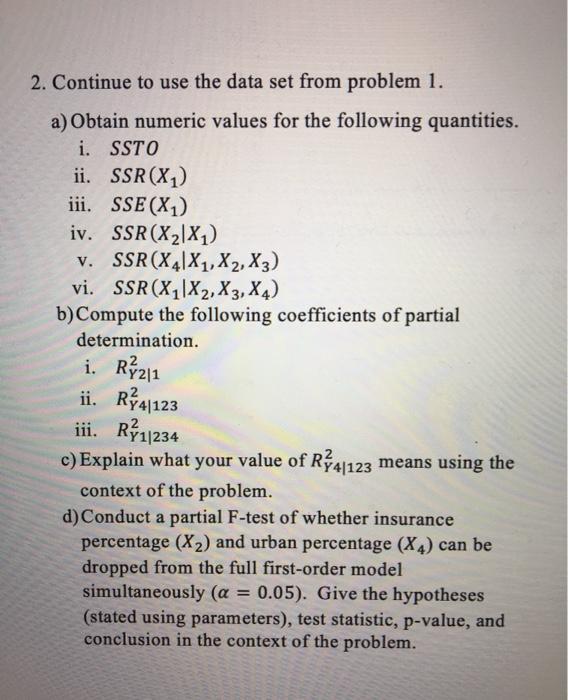
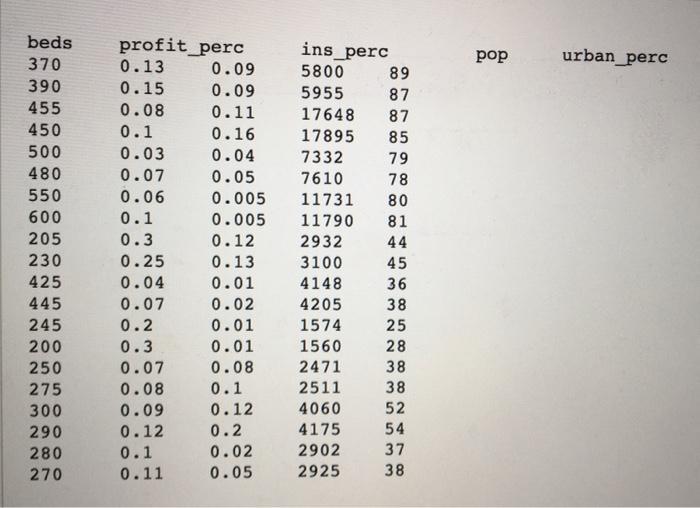
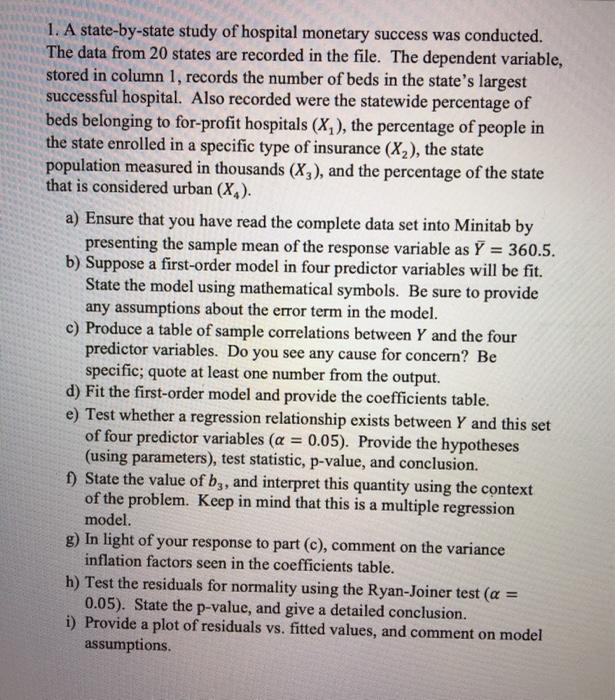
2. Continue to use the data set from problem 1. a) Obtain numeric values for the following quantities. i. SSTO ii. SSR (X) iii. SSE (X) iv. SSR (XX) v. SSR (X4X1, X2, X3) vi. SSR (XX2, X3, X4) b) Compute the following coefficients of partial determination. i. R2|1 ii. R4|123 iii. R1|234 c) Explain what your value of R41123 means using the context of the problem. d) Conduct a partial F-test of whether insurance percentage (X) and urban percentage (X4) can be dropped from the full first-order model simultaneously (a = 0.05). Give the hypotheses (stated using parameters), test statistic, p-value, and conclusion in the context of the problem. beds 370 390 455 450 500 480 550 600 205 230 profit_perc 0.13 0.09 0.15 0.09 0.08 0.11 0.1 0.16 0.03 0.04 0.07 0.05 0.06 0.1 0.3 0.25 0.04 425 445 0.07 245 0.2 200 0.3 250 0.07 275 0.08 300 0.09 290 0.12 280 0.1 270 0.11 0.005 11731 0.005 11790 2932 3100 4148 4205 1574 1560 2471 2511 4060 4175 2902 2925 0.12 0.13 0.01 0.02 0.01 0.01 0.08 ins_perc 5800 89 5955 87 17648 87 17895 85 7332 79 7610 78 80 0.1 0.12 0.2 0.02 0.05 81 44 45 36 38 25 28 38 38 52 54 37 38 pop urban_perc 1. A state-by-state study of hospital monetary success was conducted. The data from 20 states are recorded in the file. The dependent variable, stored in column 1, records the number of beds in the state's largest successful hospital. Also recorded were the statewide percentage of beds belonging to for-profit hospitals (X), the percentage of people in the state enrolled in a specific type of insurance (X), the state population measured in thousands (X3), and the percentage of the state that is considered urban (X). a) Ensure that you have read the complete data set into Minitab by presenting the sample mean of the response variable as Y = 360.5. b) Suppose a first-order model in four predictor variables will be fit. State the model using mathematical symbols. Be sure to provide any assumptions about the error term in the model. c) Produce a table of sample correlations between Y and the four predictor variables. Do you see any cause for concern? Be specific; quote at least one number from the output. d) Fit the first-order model and provide the coefficients table. e) Test whether a regression relationship exists between Y and this set of four predictor variables (a = 0.05). Provide the hypotheses (using parameters), test statistic, p-value, and conclusion. f) State the value of b3, and interpret this quantity using the context of the problem. Keep in mind that this is a multiple regression model. g) In light of your response to part (c), comment on the variance inflation factors seen in the coefficients table. h) Test the residuals for normality using the Ryan-Joiner test ( = 0.05). State the p-value, and give a detailed conclusion. i) Provide a plot of residuals vs. fitted values, and comment on model assumptions.
Step by Step Solution
3.49 Rating (149 Votes )
There are 3 Steps involved in it
erm Coef SE Coef TValue PValue VIF Co... View full answer

Get step-by-step solutions from verified subject matter experts