

Question: Start off with a brief introduction describing the main concepts of the lab including both invasive species information and successional types and urban ecology.
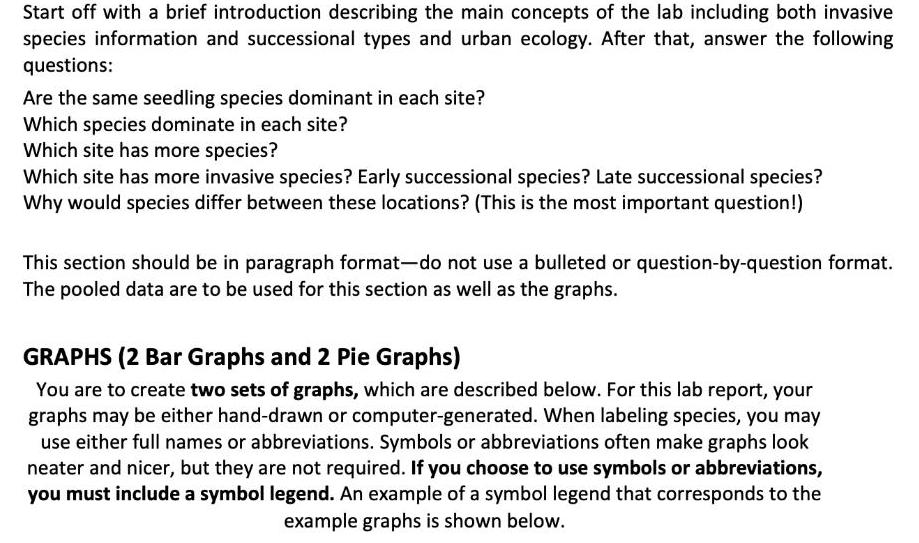
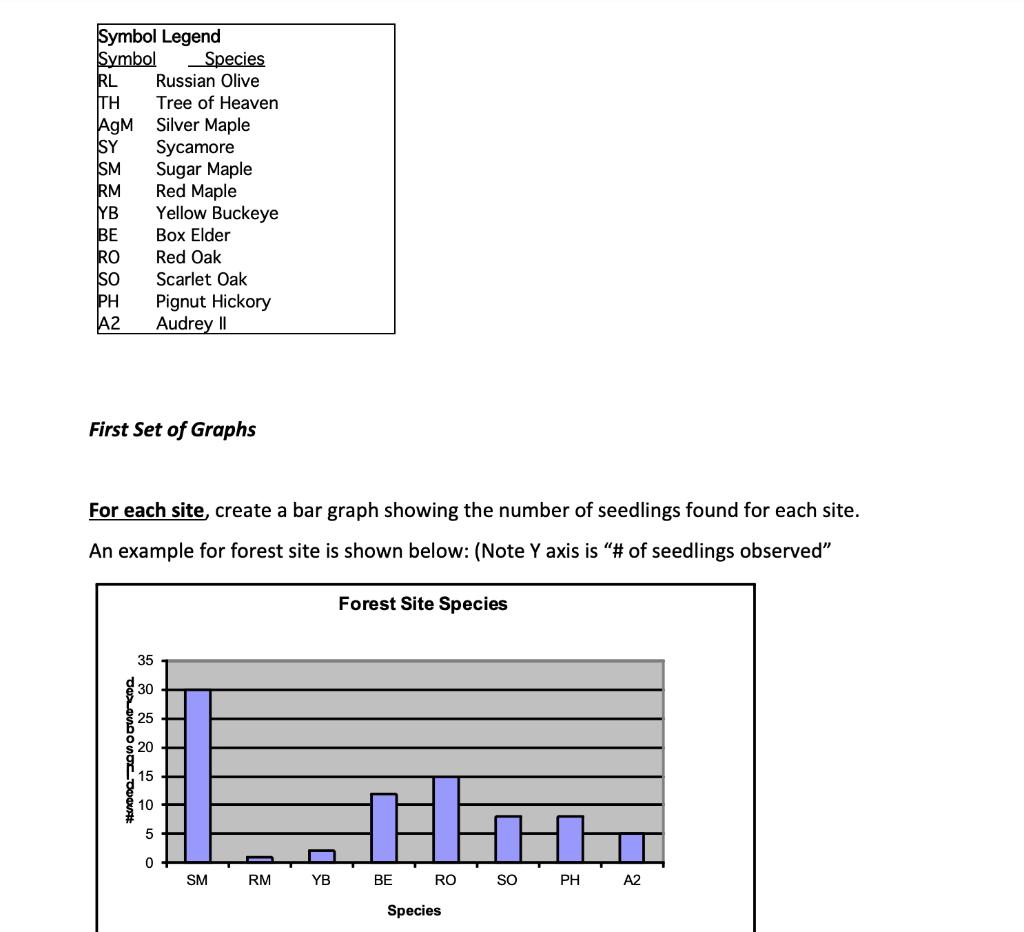
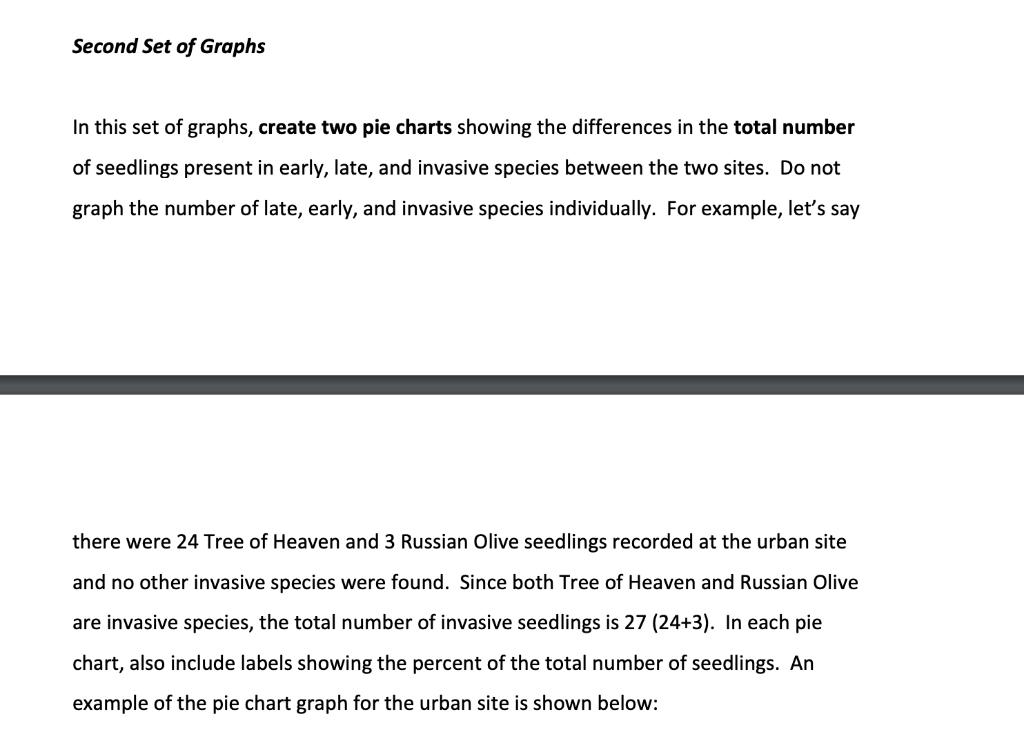
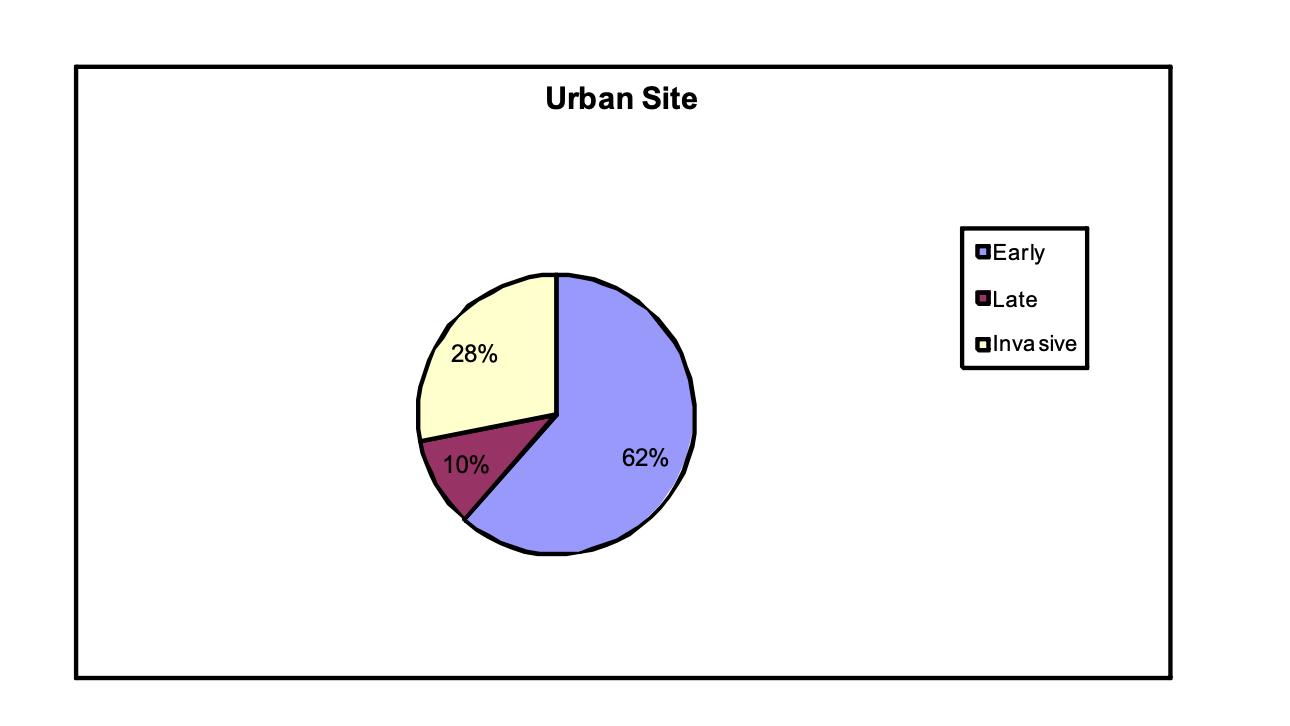
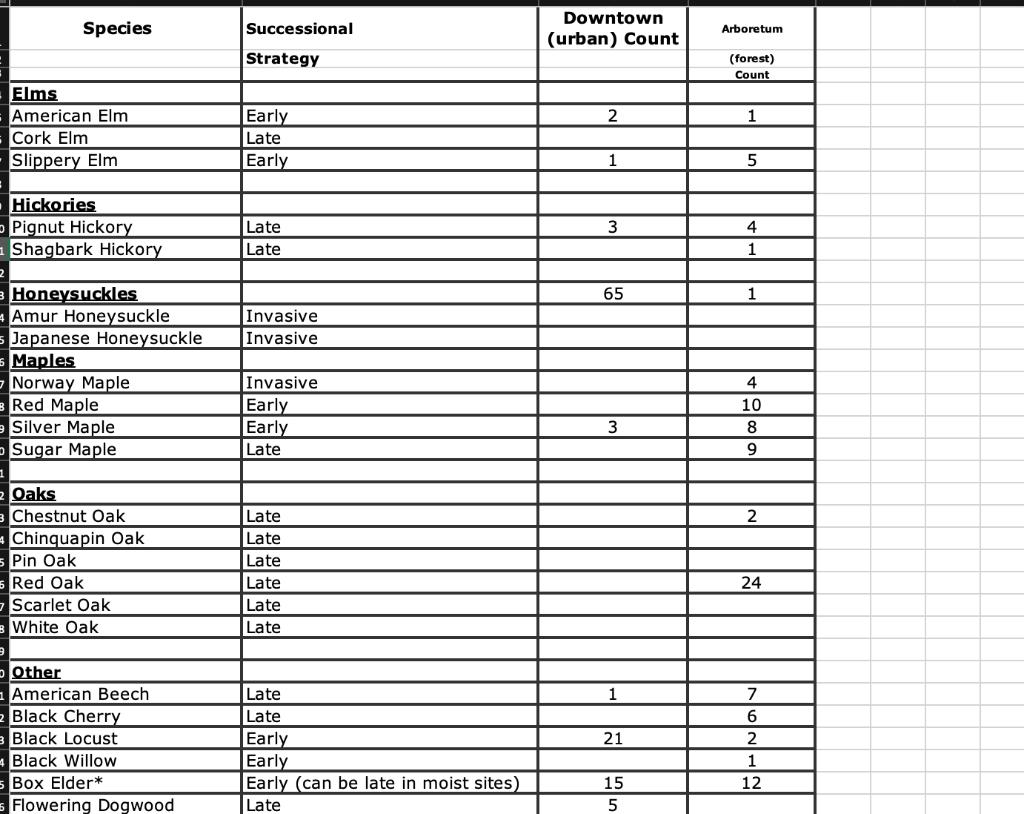
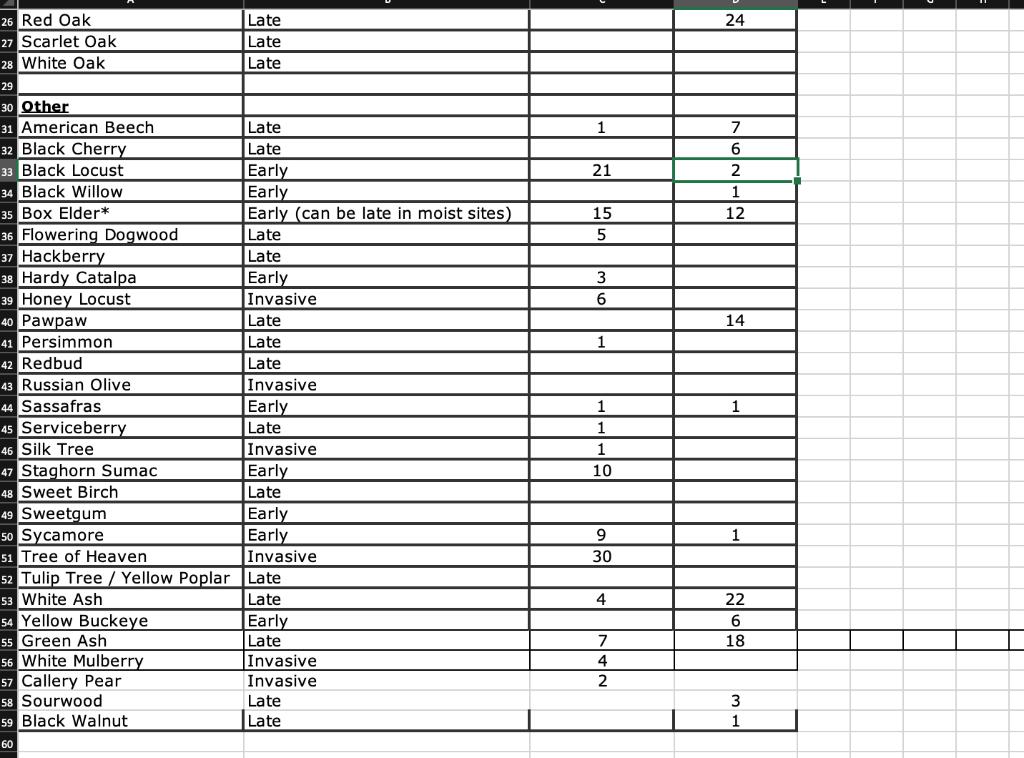
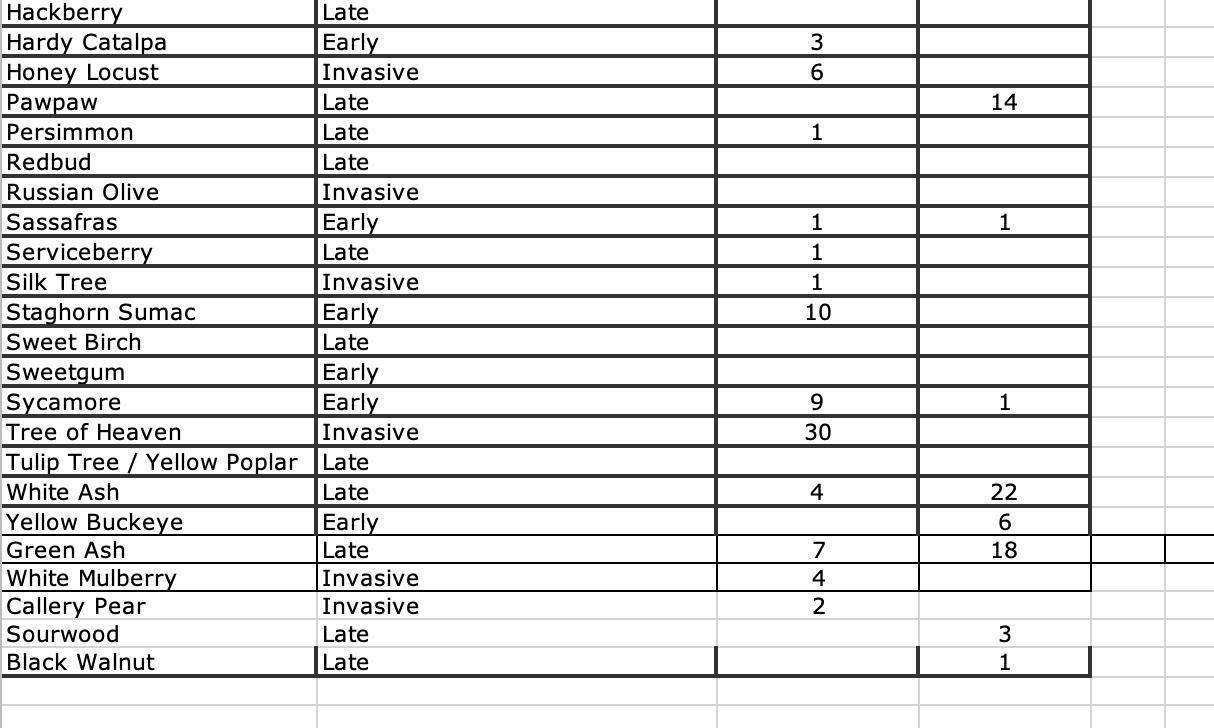
Start off with a brief introduction describing the main concepts of the lab including both invasive species information and successional types and urban ecology. After that, answer the following questions: Are the same seedling species dominant in each site? Which species dominate in each site? Which site has more species? Which site has more invasive species? Early successional species? Late successional species? Why would species differ between these locations? (This is the most important question!) This section should be in paragraph format-do not use a bulleted or question-by-question format. The pooled data are to be used for this section as well as the graphs. GRAPHS (2 Bar Graphs and 2 Pie Graphs) You are to create two sets of graphs, which are described below. For this lab report, your graphs may be either hand-drawn or computer-generated. When labeling species, you may use either full names or abbreviations. Symbols or abbreviations often make graphs look neater and nicer, but they are not required. If you choose to use symbols or abbreviations, you must include a symbol legend. An example of a symbol legend that corresponds to the example graphs is shown below. Symbol Legend Symbol Species RL Russian Olive AgM SY SM RM YB BE RO SO PH A2 35 TENDONO downst First Set of Graphs 30 For each site, create a bar graph showing the number of seedlings found for each site. An example for forest site is shown below: (Note Y axis is "# of seedlings observed" Forest Site Species 25 20 15 10 Tree of Heaven Silver Maple 5 Sycamore Sugar Maple Red Maple Yellow Buckeye 0 Box Elder Red Oak Scarlet Oak Pignut Hickory Audrey II SM RM YB BE RO Species SO PH A2 Second Set of Graphs In this set of graphs, create two pie charts showing the differences in the total number of seedlings present in early, late, and invasive species between the two sites. Do not graph the number of late, early, and invasive species individually. For example, let's say there were 24 Tree of Heaven and 3 Russian Olive seedlings recorded at the urban site and no other invasive species were found. Since both Tree of Heaven and Russian Olive are invasive species, the total number of invasive seedlings is 27 (24+3). In each pie chart, also include labels showing the percent of the total number of seedlings. An example of the pie chart graph for the urban site is shown below: 28% 10% Urban Site 62% Early Late Inva sive Species Elms American Elm Cork Elm Slippery Elm Hickories Pignut Hickory Shagbark Hickory Honeysuckles Amur Honeysuckle Japanese Honeysuckle Maples Norway Maple Red Maple Silver Maple Sugar Maple Oaks Chestnut Oak Chinquapin Oak Pin Oak Red Oak Scarlet Oak White Oak Other American Beech Black Cherry Black Locust Black Willow Box Elder* Flowering Dogwood Successional Strategy Early Late Early Late Late Invasive Invasive Invasive Early Early Late Late Late Late Late Late Late Late Late Early Early Early (can be late in moist sites) Late Downtown (urban) Count 2 3 65 3 1 21 15 5 Arboretum (forest) Count 1 5 4 1 1 4 10 8 9 2 24 7 6 2 1 12 26 Red Oak 27 Scarlet Oak 28 White Oak 29 30 Other 31 American Beech 32 Black Cherry 33 Black Locust 34 Black Willow 35 Box Elder* 36 Flowering Dogwood 37 Hackberry 38 Hardy Catalpa 39 Honey Locust 40 Pawpaw 41 Persimmon 42 Redbud 43 Russian Olive 44 Sassafras 45 Serviceberry 46 Silk Tree 47 Staghorn Sumac 48 Sweet Birch 49 Sweetgum 50 Sycamore 51 Tree of Heaven 54 Yellow Buckeye 55 Green Ash Late Late Late 56 White Mulberry 57 Callery Pear 58 Sourwood 59 Black Walnut 60 Late Late Early Early Early (can be late in moist sites) Late Late Early Invasive Late Late Late Invasive Early Late Invasive Early Late 52 Tulip Tree/ Yellow Poplar Late 53 White Ash Late Early Early Invasive Early Late Invasive Invasive Late Late 1 21 15 BALET 10 30 4 7 4 2 24 7 6 2 1 12 14 1 1 22 6 18 3 1 Hackberry Hardy Catalpa Honey Locust Pawpaw Persimmon Redbud Russian Olive Sassafras Serviceberry Silk Tree Staghorn Sumac Sweet Birch Sweetgum Sycamore Late Early Invasive Yellow Buckeye Green Ash White Mulberry Callery Pear Sourwood Black Walnut Late Late Late Invasive Early Late Invasive Early Late Early Early Invasive Tree of Heaven Tulip Tree / Yellow Poplar Late White Ash Late Early Late Invasive Invasive Late Late 3 6 1 1 1 1 10 9 30 4 7 4 2 14 1 1 22 6 18 3 1
Step by Step Solution
There are 3 Steps involved in it
No sugar maple is the dominant seeding as its number is more than other seedings Honeysuckles and m... View full answer

Get step-by-step solutions from verified subject matter experts