

Ember Inc. prepared the budget for 2017 assuming a 20% market share based on total sales...
Fantastic news! We've Found the answer you've been seeking!
Question:
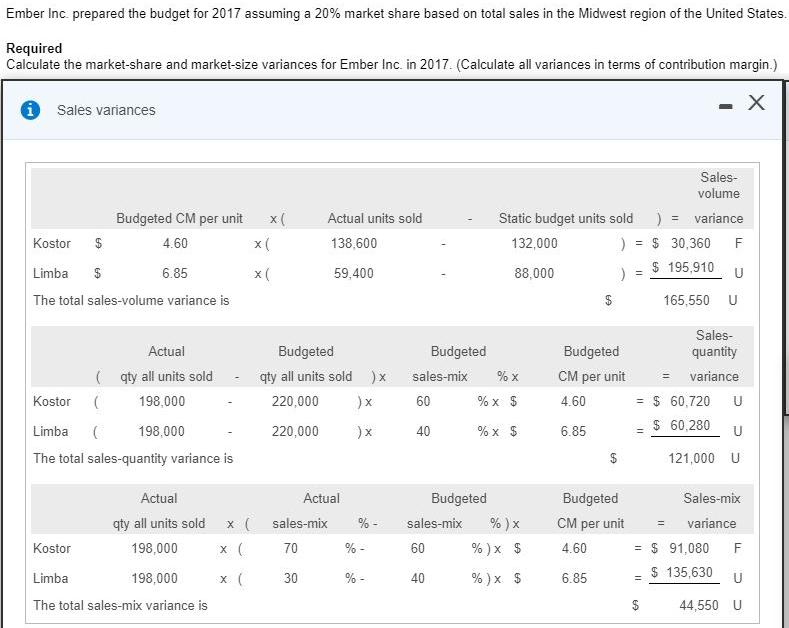

Expert Answer:

Related Book For 
Horngrens Cost Accounting A Managerial Emphasis
ISBN: 978-0134475585
16th edition
Authors: Srikant M. Datar, Madhav V. Rajan
Posted Date:
