

Question: ACCOUNTING Here are comparative statement data for Duke Company and Lord Company, two competitors. All balance sheet data are as of December 31, 2020, and
 ACCOUNTING
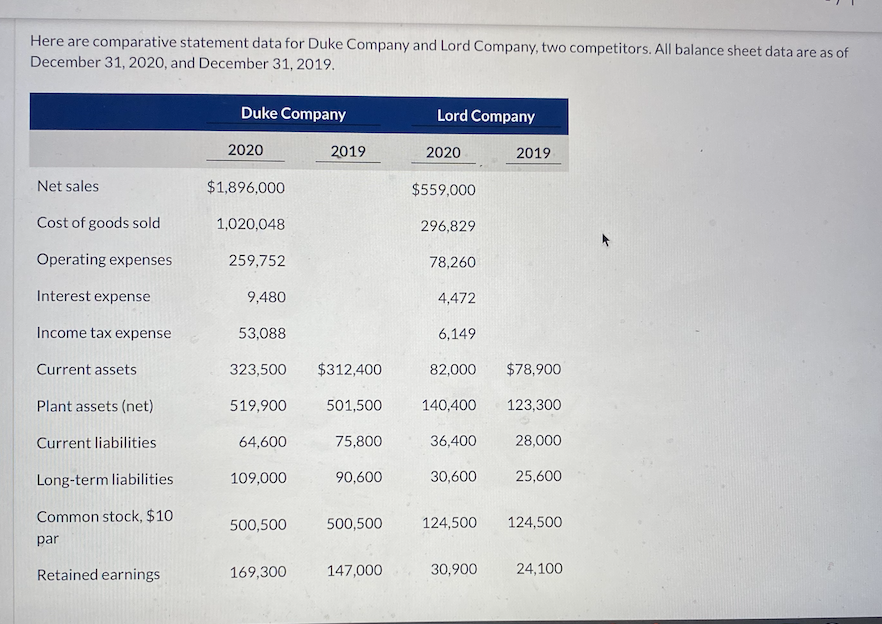
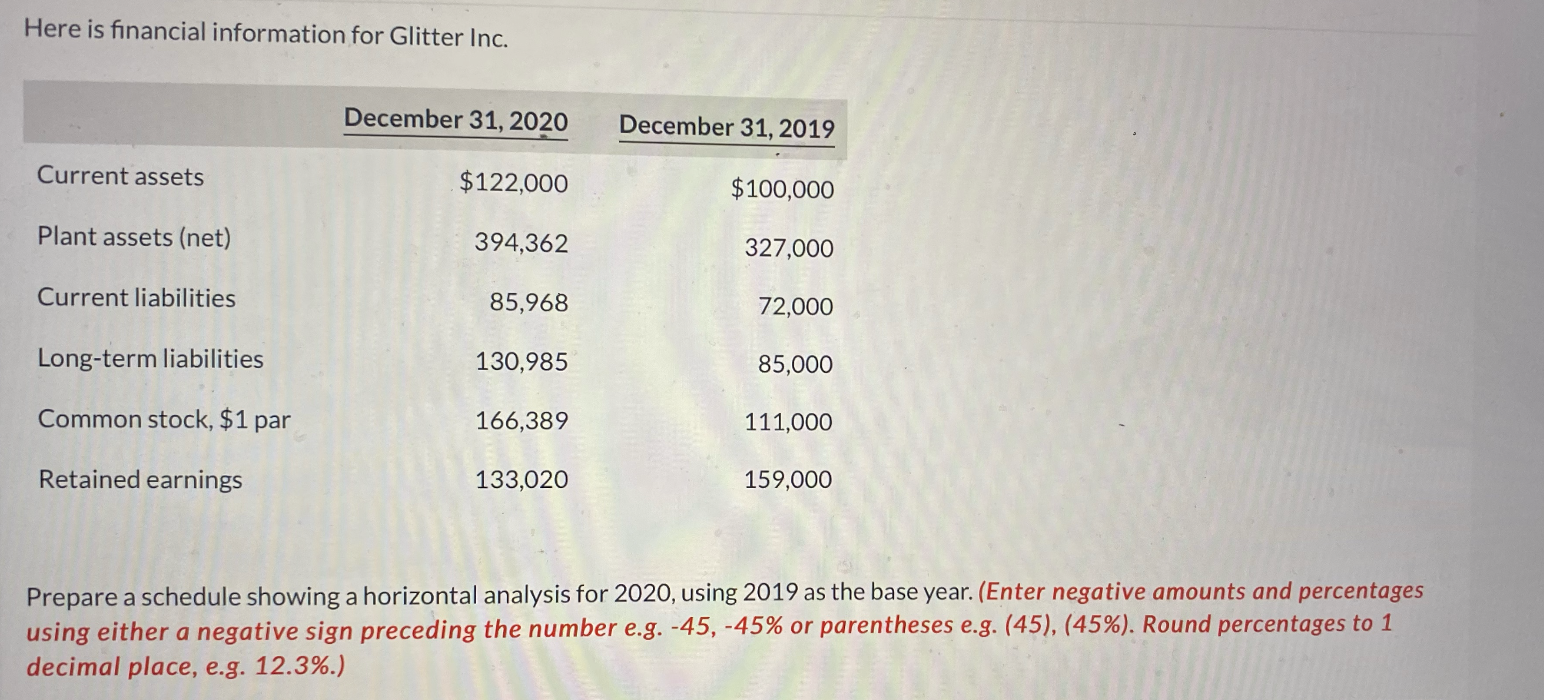
Here are comparative statement data for Duke Company and Lord Company, two competitors. All balance sheet data are as of December 31, 2020, and December 31, 2019. Duke Company Lord Company 2020 2019 2020 2019 Net sales $1,896,000 $559,000 Cost of goods sold 1,020,048 296,829 Operating expenses 259,752 78,260 Interest expense 9,480 4,472 Income tax expense 53,088 6,149 Current assets 323,500 $312,400 82,000 $78,900 Plant assets (net) 519,900 501,500 140,400 123,300 Current liabilities 64,600 75,800 36,400 28,000 Long-term liabilities 109,000 90,600 30,600 25,600 Common stock, $10 par 500,500 500,500 124,500 124,500 Retained earnings 169,300 147,000 30,900 24,100 Here is financial information for Glitter Inc. December 31, 2020 December 31, 2019 Current assets $122,000 $100,000 Plant assets (net) 394,362 327,000 Current liabilities 85,968 72,000 Long-term liabilities 130,985 85,000 Common stock, $1 par 166,389 111,000 Retained earnings 133,020 159,000 Prepare a schedule showing a horizontal analysis for 2020, using 2019 as the base year. (Enter negative amounts and percentages using either a negative sign preceding the number e.g. -45, -45% or parentheses e.g. (45), (45%). Round percentages to 1 decimal place, e.g. 12.3%.)
Step by Step Solution
There are 3 Steps involved in it

Get step-by-step solutions from verified subject matter experts