

Question: i Data Table Creek Enterprises Income Statement for the Year Ended December 31, 2019 Sales revenue Less: Cost of goods sold Gross profits Less:

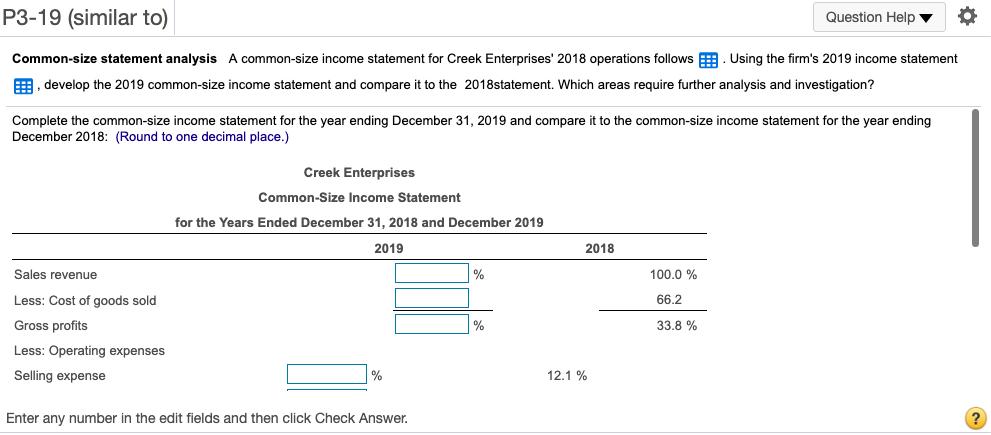
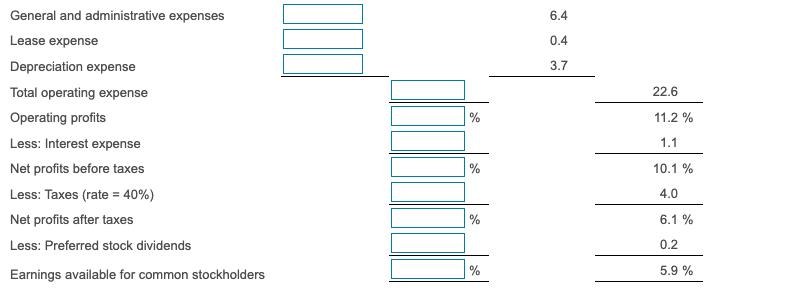
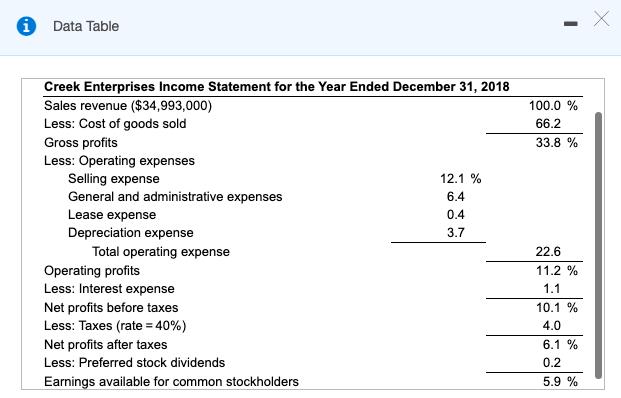
i Data Table Creek Enterprises Income Statement for the Year Ended December 31, 2019 Sales revenue Less: Cost of goods sold Gross profits Less: Operating expenses Selling expense General and administrative expenses Lease expense Depreciation expense Total operating expense Operating profits Less: Interest expense Net profits before taxes Less: Taxes (rate = 40%) Net profits after taxes Less: Preferred stock dividends Earnings available for common stockholders $2,982,000 1,811,000 190,000 1,030,000 $30,013,000 21,037,000 $8,976,000 6,013,000 $2,963,000 1,009,000 $1,954,000 781,600 $1,172,400 91,000 $1,081,400 I X P3-19 (similar to) Common-size statement analysis A common-size income statement for Creek Enterprises' 2018 operations follows. Using the firm's 2019 income statement E, develop the 2019 common-size income statement and compare it to the 2018statement. Which areas require further analysis and investigation? Complete the common-size income statement for the year ending December 31, 2019 and compare it to the common-size income statement for the year ending December 2018: (Round to one decimal place.) Sales revenue Less: Cost of goods sold Gross profits Less: Operating expenses Selling expense Creek Enterprises Common-Size Income Statement for the Years Ended December 31, 2018 and December 2019 2019 % Enter any number in the edit fields and then click Check Answer. % % 2018 12.1% 100.0 % 66.2 33.8 % Question Help General and administrative expenses Lease expense Depreciation expense Total operating expense Operating profits Less: Interest expense Net profits before taxes Less: Taxes (rate= 40%) Net profits after taxes Less: Preferred stock dividends Earnings available for common stockholders didid % % 6.4 X 0.4 3.7 22.6 11.2 % 1.1 10.1 % 4.0 6.1% 0.2 5.9 % i Data Table Creek Enterprises Income Statement for the Year Ended December 31, 2018 Sales revenue ($34,993,000) Less: Cost of goods sold Gross profits Less: Operating expenses Selling expense General and administrative expenses Lease expense Depreciation expense Total operating expense Operating profits Less: Interest expense Net profits before taxes Less: Taxes (rate=40%) Net profits after taxes Less: Preferred stock dividends Earnings available for common stockholders 12.1 % 6.4 0.4 3.7 100.0 % 66.2 33.8 % 22.6 11.2 % 1.1 10.1 % 4.0 6.1 % 0.2 5.9 % X
Step by Step Solution
There are 3 Steps involved in it
1 2 3 4 Sales 5 Less COGS BJ BK Creek Enterprises Common Size Income Stat... View full answer

Get step-by-step solutions from verified subject matter experts