

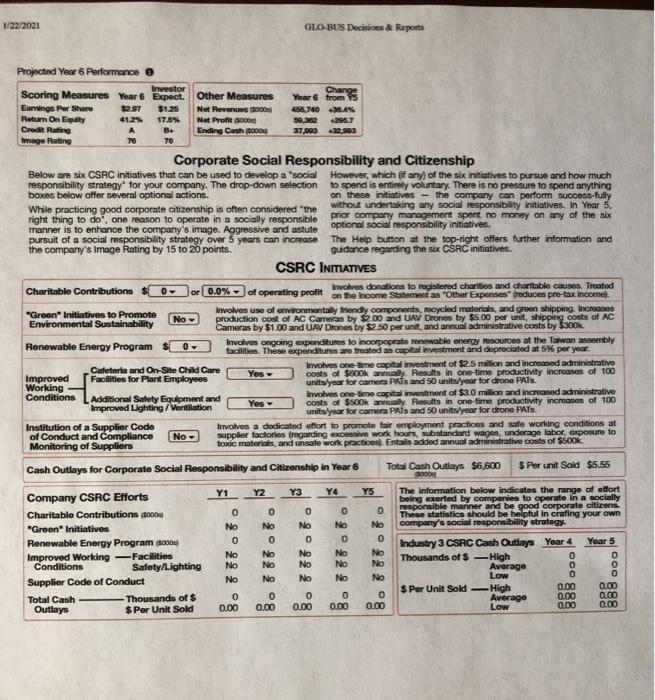
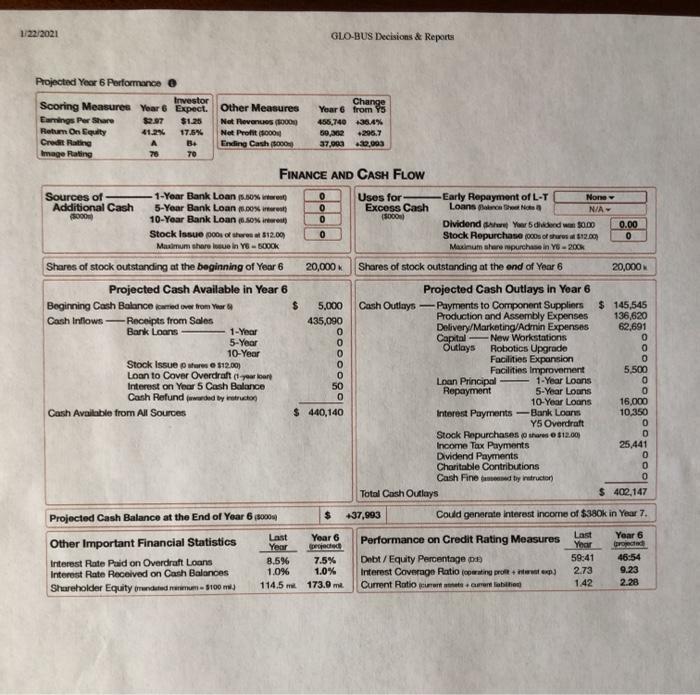
Question: Please explain the below chart in more than 1 page. (i.e.. ROE, Credit Rating, Image Rating, Net Revenue, Net Profit, Earnings Per Share, Action-Capture Camera
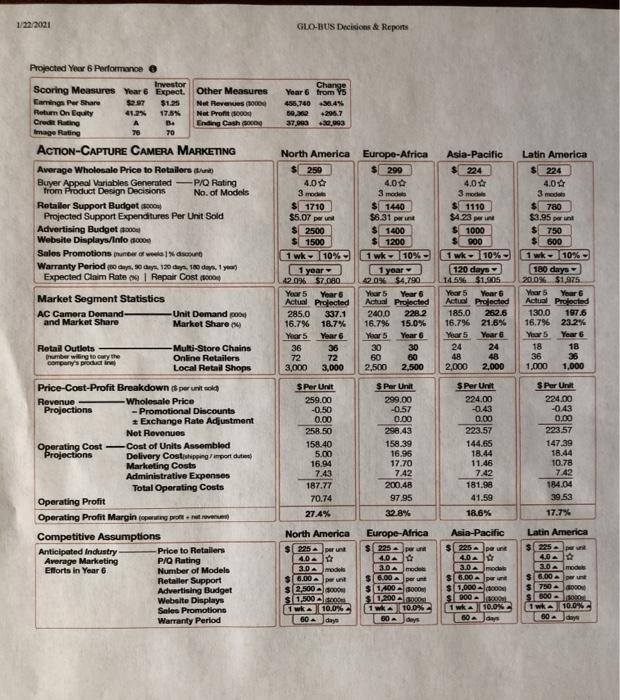
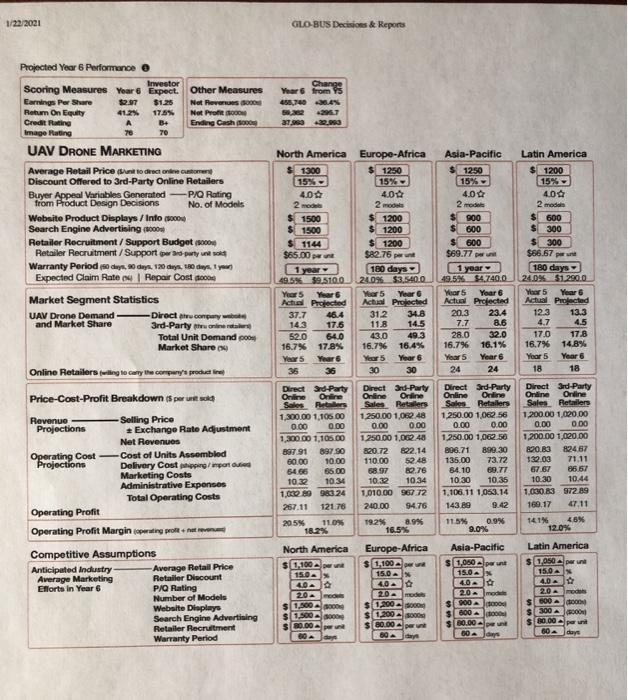
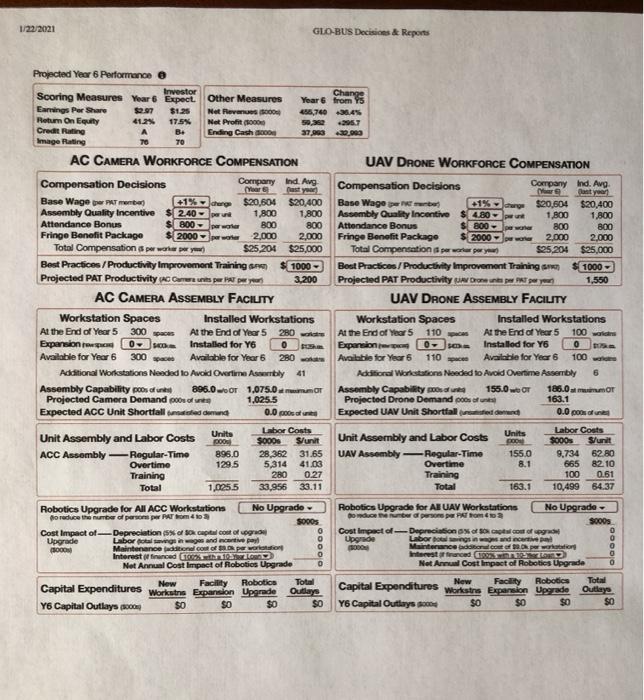
Please explain the below chart in more than 1 page. (i.e.. ROE, Credit Rating, Image Rating, Net Revenue, Net Profit, Earnings Per Share, Action-Capture Camera Design and UAV Drone Design in North America, Europe-Africa, Asia-Pacific, Latin America) Please explain as much as possible.
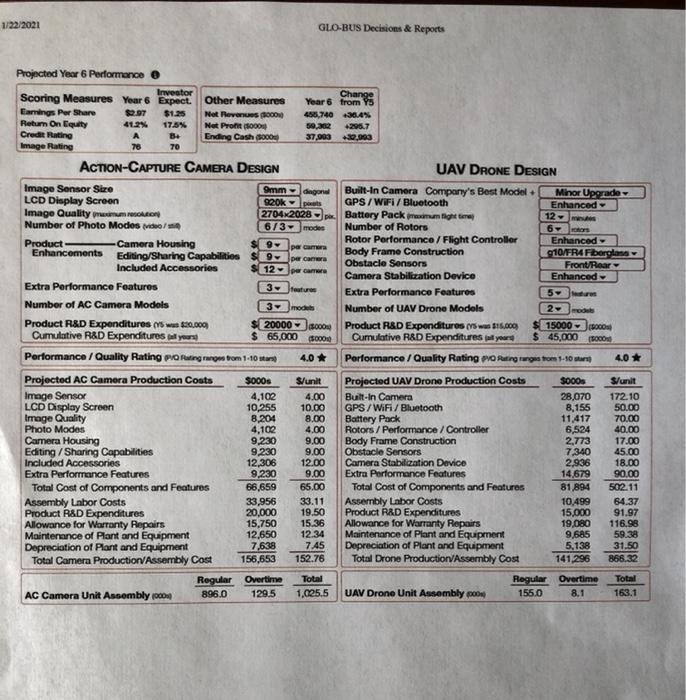
1/22/2021 Projected Year 6 Performance e Scoring Measures Earnings Per Share Return On Equity Credit Rating Image Rating Image Sensor Size LCD Display Screen Year 6 $2.97 41.2% A 76 ACTION-CAPTURE CAMERA DESIGN Enhancements Investor Expect. $1.25 17.5% 8+ 70 Image Quality maximum resolution Number of Photo Modes video/ Product- Other Measures Not Revenues (3000) Net Profit (1000 Ending Cash (000) -Camera Housing Editing/Sharing Capabilities Included Accessories Editing/Sharing Capabilities Included Accessories Extra Performance Features Projected AC Camera Production Costs Image Sensor LCD Display Screen Image Quality Photo Modes Camera Housing Extra Performance Features Number of AC Camera Models Product R&D Expenditures (5 was $20,000) Cumulative R&D Expenditures all yours) Performance / Quality Rating P/Q Rating ranges from 1-10 stars) Total Cost of Components and Features Assembly Labor Costs Product R&D Expenditures Allowance for Warranty Repairs Maintenance of Plant and Equipment Depreciation of Plant and Equipment Total Camera Production/Assembly Cost AC Camera Unit Assembly (000) 9mm 920k pits 2704x2028 px 6/3 modes $000s 9- 9- 12- per camera par camera per camera 3- 3- $20000- 000) $ 65,000 (5000) 4,102 9,230 9,230 GLO-BUS Decisions & Reports Year 6 from 455,740 59,302 37,903 Regular Overtime 896.0 129.5 diagonal features 4.0 $/unit 4,102 4.00 10,255 10.00 8,204 8.00 4.00 models 9.00 9.00 12,306 9,230 66,659 33,956 20,000 15,750 15.36 12,650 12.34 7,638 7.45 152.76 156,653 12.00 9.00 65.00 33.11 19.50 Change Total 1,025.5 +36.4% +295.7 +32,003 UAV DRONE DESIGN Built-In Camera Company's Best Model+ GPS/WiFi/Bluetooth Battery Pack maximum fight time Number of Rotors Rotor Performance/Flight Controller Body Frame Construction Obstacle Sensors Camera Stabilization Device Body Frame Construction Obstacle Sensors Camera Stabilization Device Extra Performance Features Total Cost of Components and Features Assembly Labor Costs Product R&D Expenditures Allowance for Warranty Repairs Maintenance of Plant and Equipment Depreciation of Plant and Equipment Total Drone Production/Assembly Cost Minor Upgrade Enhanced UAV Drone Unit Assembly po0) 12- 6-> rotors Enhanced 010/FR4 Fiberglass features Extra Performance Features Number of UAV Drone Models Product R&D Expenditures (swas $15,000) Cumulative R&D Expenditures all yeard models $15000-(000) $ 45,000 (500 Performance / Quality Rating PVO Rating ranges from 1-10 stars) Projected UAV Drone Production Costs Built-In Camera GPS/WiFi/Bluetooth Battery Pack Rotors/Performance / Controller Front/Rear Enhanced- 5- 2- 5000 28,070 8,155 11,417 6,524 2,773 7,340 2,936 14,679 81,894 9,685 5,138 141,296 4.0 Regular Overtime 155.0 8.1 $/unit 172.10 50.00 70.00 40.00 17.00 10,499 64.37 15,000 91.97 19,080 116.98 59.38 31.50 866.32 45.00 18.00 90.00 502.11 Total 163.1
Step by Step Solution
3.48 Rating (145 Votes )
There are 3 Steps involved in it
SOLUTION Here is my summary of the chart This chart shows projected financial and operational performance for Year 6 for an action camera and UAV drone manufacturing company Some key takeaways Revenue ... View full answer

Get step-by-step solutions from verified subject matter experts