

Question: After building a scientific way for demand forecasting, Mary hoped Jason can propose the optimal inventory/ordering policies for these 4 products for the first week
After building a scientific way for demand forecasting, Mary hoped Jason can propose the optimal inventory/ordering policies for these 4 products for the first week of 2019. The sale price/unit for each product is listed below:
Product A | Product B | Product C | Product D |
$220 | $50 | $5 | $3 |
Jason decided to use ABC rule to classify these 4 products. ‘A’ category product(s) will have the target service level of 95%. ‘B’ product(s) will have the target service level 90% and ‘C’ products(s) will have the target service level 85%. After setting the appropriate service level, Jason will use the service level information to calculate the safety stock level for each product. How should Jason classify the ABC products? After classifying these 4 products, Jason wanted to use the ROP model for inventory/ordering management. He believed he would get an accurate demand forecasting for the first week of 2019. But based on the historical data, he found the lead time of orders has a variation for all these 4 products. Which ROP model should Jason implement? What are the reorder points for each of these 4 products for the first week of 2019?
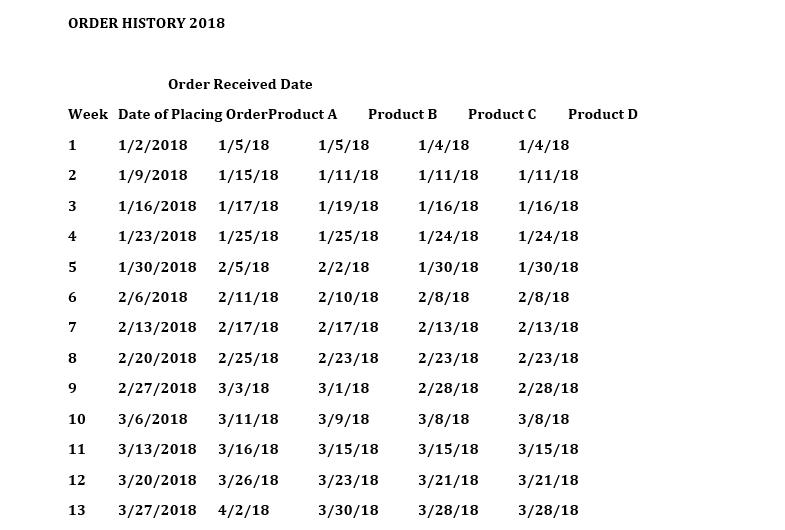
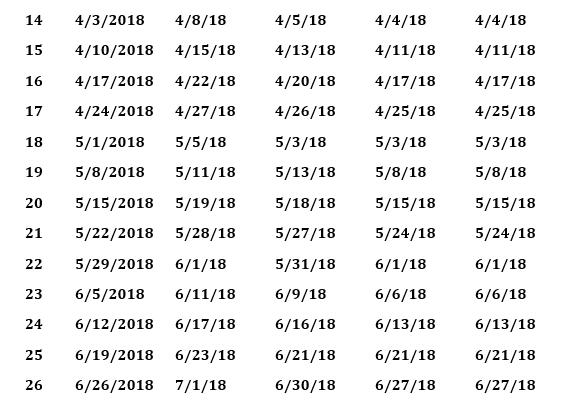
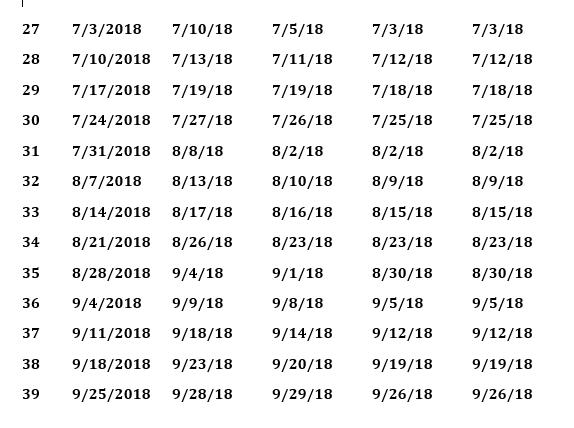
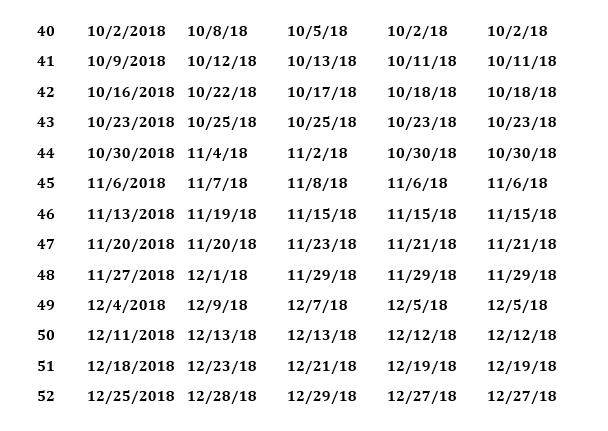
ORDER HISTORY 2018 Order Received Date Week Date of Placing OrderProduct A Product B Product C Product D 1 1/2/2018 1/5/18 1/5/18 1/4/18 1/4/18 1/9/2018 1/15/18 1/11/18 1/11/18 1/11/18 3 1/16/2018 1/17/18 1/19/18 1/16/18 1/16/18 4 1/23/2018 1/25/18 1/25/18 1/24/18 1/24/18 1/30/2018 2/5/18 2/2/18 1/30/18 1/30/18 6. 2/6/2018 2/11/18 2/10/18 2/8/18 2/8/18 7 2/13/2018 2/17/18 2/17/18 2/13/18 2/13/18 2/20/2018 2/25/18 2/23/18 2/23/18 2/23/18 9. 2/27/2018 3/3/18 3/1/18 2/28/18 2/28/18 10 3/6/2018 3/11/18 3/9/18 3/8/18 3/8/18 11 3/13/2018 3/16/18 3/15/18 3/15/18 3/15/18 12 3/20/2018 3/26/18 3/23/18 3/21/18 3/21/18 13 3/27/2018 4/2/18 3/30/18 3/28/18 3/28/18
Step by Step Solution
3.39 Rating (152 Votes )
There are 3 Steps involved in it
Ans Forecasting Here we choose Simple Moving Average 4month Model as lot of historical data is avail... View full answer

Get step-by-step solutions from verified subject matter experts