

Question: Table 4: Branded Operating Benchmarks Year 16 Branded Operating Benchmarks Industry 5 Average North America Company Low High Distribution and Warehouse Costs 4.39 6.52
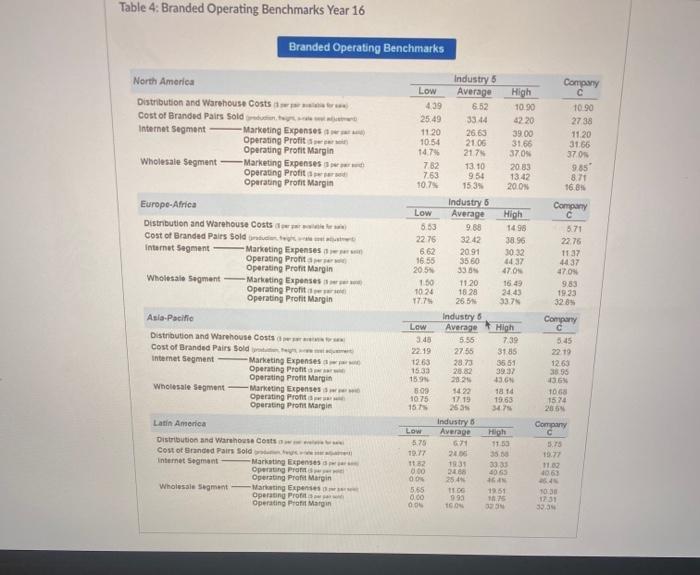
Table 4: Branded Operating Benchmarks Year 16 Branded Operating Benchmarks Industry 5 Average North America Company Low High Distribution and Warehouse Costs 4.39 6.52 10.90 10.90 Cost of Branded Pairs Sold n, te e Marketing Expenses a Operating Profit e Operating Profit Margin Wholesale Segment -Marketing Expenses rd Operating Profit r Operating Profit Margin 25.49 33 44 42.20 27 38 Internet Segment 11.20 26.63 10.54 14.7% 21.06 217% 39.00 31.66 37.0% 11.20 31.66 37.0% 7.82 7.63 10.7% 13. 10 954 15,3% 20 83 13 42 20.0% 9.85 8.71 16.8% Industry 6 Average Europe-Africa Company Low High Distribution and Warehouse Costs ee Cost of Branded Pairs Sold da t t atat Internet Segment- 6.53 9.68 14 98 5.71 22 76 3242 38.96 22.76 Marketing Expenses ae Operating Profit aer Operating Profit Margin Marketing Expenses r Operating Profit e Operating Profit Margin 6.62 16.55 20 5% 2091 3560 30.32 44 37 47.0% 11 37 44.37 47.0% Wholesale Segment 1.50 10.24 17.7% 11 20 16 28 26 5% 16 49 24.43 33.7% 9.83 19.23 328% Industry 6 Average Asla-Pacific Company Low High Distribution and Warehouse Costs ae Cost of Branded Pairs Sold t e Internet Segment 3.48 5.55 7.39 545 22 19 2755 31.85 2219 -Marketing Expenses a Operating Profita Operating Profit Margin -Marketing Expenses Operating Proft a Operating Pront Margin 12.63 1533 15.9% 28 73 28.82 20.2% 35 51 39.37 43.GN 12.63 38.95 43.6N Wholesale Segment- 10.75 157% 14.22 17 19 26 3% 18 14 19.63 347% 10 68 1574 26 5N Industry 6 Average Latin America Company Low High 11.53 Distribution and Warehouse Costs w Cost of Branded Pairs Sold internet Segment 5.75 671 5.75 19.77 24.06 35 8 19.77 Marketing Expenses a Operating Protn Operating Profit Margin Markating Expenses Operating Profit Operating Protit Margin 1182 0.00 1931 24.68 25 4% 33.33 40 63 46 AN 11.02 40.63 46.4 Wholesale Segment 5.65 0.00 1100 1951 1038 1231 993 16.0% Question 19 5 pts List two (2) operating elements that Company C can improve on in the North America region. HTML Editor BIUA ,E x x =E P T T 12pt Paragraph Font Szes
Step by Step Solution
3.33 Rating (150 Votes )
There are 3 Steps involved in it
1 2 operating elements that the company can improve in North A... View full answer

Get step-by-step solutions from verified subject matter experts