

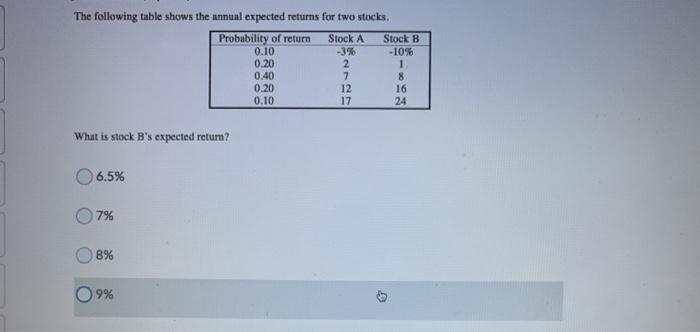
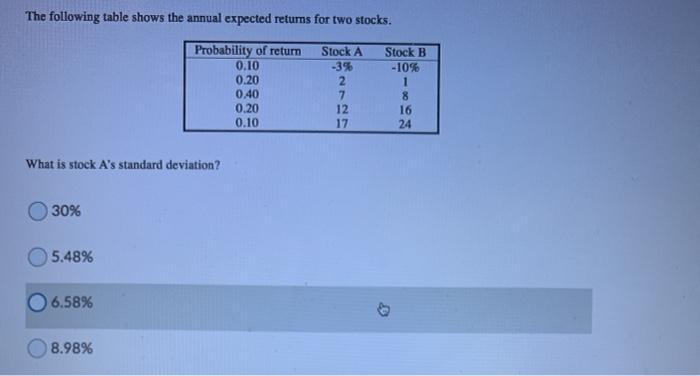
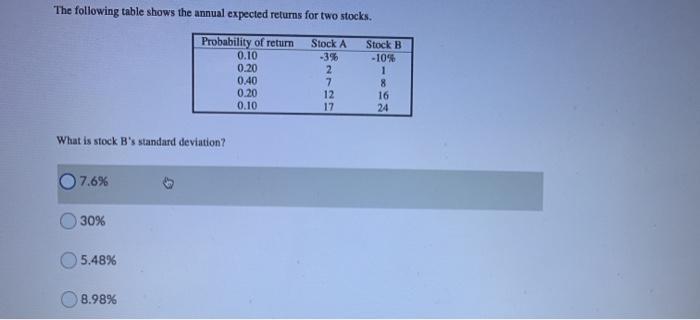
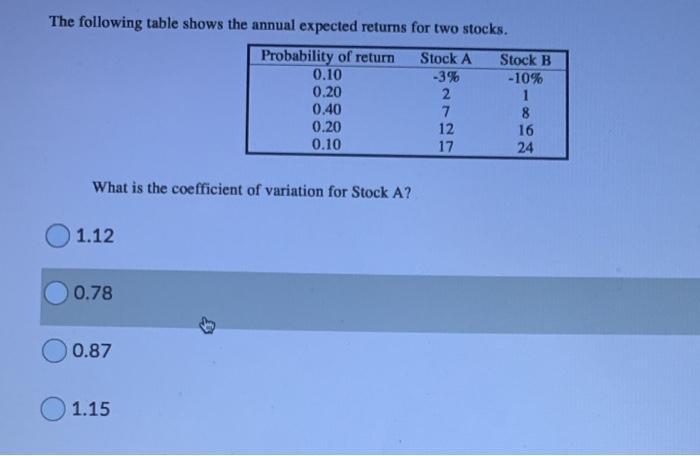
The following table shows the annual expected returms for two stocks. Probability of return 0.10 0.20...
Fantastic news! We've Found the answer you've been seeking!
Question:
Expert Answer:
1 Stock Bs expected return 8 Expected return of stock B Rate of return x Probability ... View the full answer

Related Book For 

Fundamentals of Investments
ISBN: 978-0132926171
3rd edition
Authors: Gordon J. Alexander, William F. Sharpe, Jeffery V. Bailey
Posted Date:
