

Question: the real balance sheet for Omnivest 2016| ASSETS 2019 2018 2017 269,405 Balance with banks and money at call 71,492 Deposits with banks 34,607
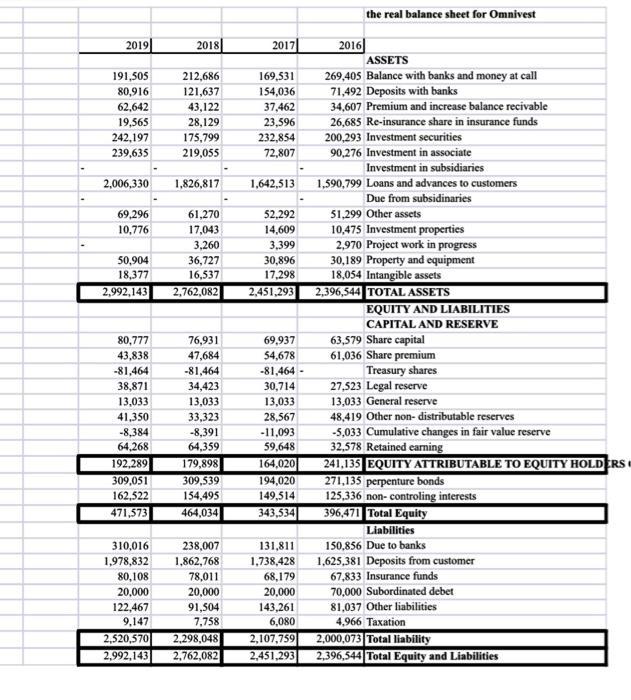
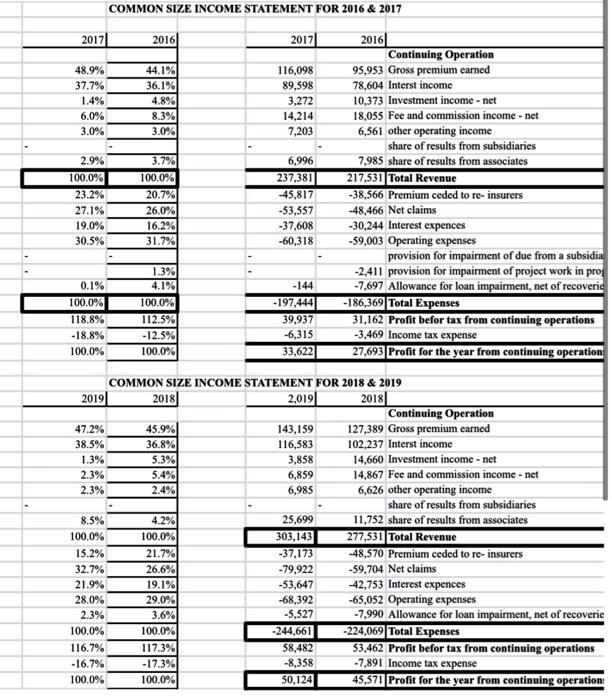
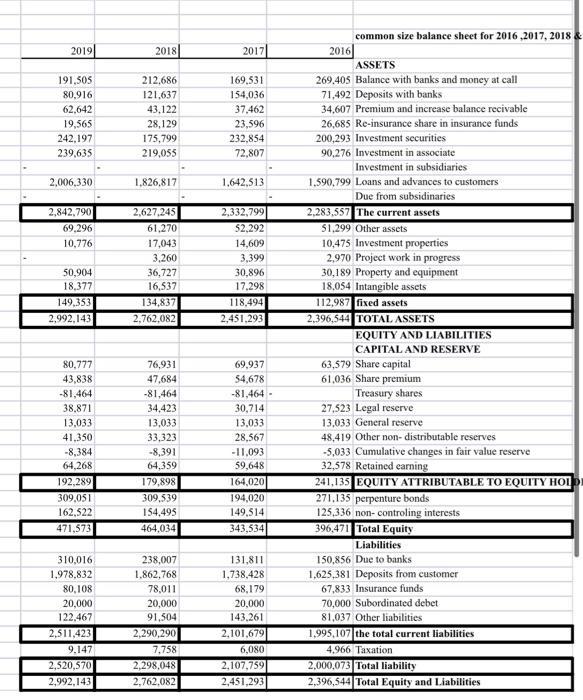

the real balance sheet for Omnivest 2016| ASSETS 2019 2018 2017 269,405 Balance with banks and money at call 71,492 Deposits with banks 34,607 Premium and increase balance recivable 26,685 Re-insurance share in insurance funds 200,293 Investment securities 90,276 Investment in associate 191,505 212,686 169,531 80,916 62,642 121,637 43,122 28,129 154,036 37,462 19,565 23,596 242,197 239,635 175,799 219,055 232,854 72,807 Investment in subsidiaries 2,006,330 1,826,817 1,642,513 1,590,799 Loans and advances to customers Due from subsidinaries 69,296 10,776 61,270 52,292 51,299 Other assets 10,475 Investment properties 2,970 Project work in progress 30,189 Property and equipment 18,054 Intangible assets 2,396,544 TOTAL ASSETS 17,043 14,609 3,399 3,260 50,904 30,896 17,298 36,727 18,377 16,537 2,992,143 2,762,082 2,451,293 EQUITY AND LIABILITIES CAPITAL AND RESERVE 63,579 Share capital 61,036 Share premium 80,777 76,931 69,937 43,838 47,684 54,678 -81,464 -81,464 - Treasury shares 27,523 Legal reserve 13,033 General reserve -81,464 38,871 34,423 30,714 13,033 41,350 13,033 13,033 33,323 48,419 Other non- distributable reserves -5,033 Cumulative changes in fair value reserve 32,578 Retained carning 241,135 EQUITY ATTRIBUTABLE TO EQUITY HOLDERS 271,135 perpenture bonds 125,336 non- controling interests 396,471 Total Equity Liabilities 28,567 -8,384 -8,391 -11,093 64,268 64,359 59,648 179,898 192,289 309,051 164,020 194,020 309,539 154,495 162,522 149,514 471,573 464,034 343,534 310,016 1,978,832 80,108 238,007 131,811 150,856 Due to banks 1,625,381 Deposits from customer 67,833 Insurance funds 70,000 Subordinated debet 81,037 Other liabilities 1,862,768 1,738,428 78,011 20,000 68,179 20,000 20,000 122,467 91,504 143,261 9,147 7,758 6,080 4,966 Taxation 2,298,048 2,000,073 Total liability 2,396,544 Total Equity and Liabilities 2,520,570 2,107,759 2,451,293 2,992,143 2,762,082 COMMON SIZE INCOME STATEMENT FOR 2016 & 2017 2016| Continuing Operation 95,953 Gross premium earned 2017 2016 2017 44.1% 36.1% 4.8% 8.3% 3.0% 48.9% 116,098 37.7% 89,598 78,604 Interst income 3,272 14,214 10,373 Investment income - net 18,055 Fee and commission income - net 6,561 other operating income 1.4% 6.0% 3.0% 7,203 share of results from subsidiaries 3.7% 100.0% 20.7% 2.9% 6,996 7,985 share of results from associates 217.531 Total Revenue -38,566 Premium ceded to re- insurers -48,466 Net claims -30,244 Interest expences -59,003 Operating expenses 237,381 100.0% 23.2% -45,817 27.1% 26.0% -53,557 -37,608 -60,318 19.0% 16.2% 30.5% 31.7% provision for impairment of due from a subsidia -2,411 provision for impairment of project work in pro -7,697 Allowance for loan impaiment, net of recoverie -186,369 Total Expenses 31,162 Profit befor tax from continuing operations -3,469 Income tax expense 1.3% 4.1% 0.1% -144 100.0% 100.0% -197,444 39,937 118.8% 112.5% -18.8% -12.5% -6,315 100.0% 33,622 27,693 Profit for the year from continuing operation 100.0% COMMON SIZE INCOME STATEMENT FOR 2018 & 2019 2,019| 2018 Continuing Operation 127,389 Gross premium earned 102,237 Interst income 14,660 Investment income - net 2019 2018 45.9% 36.8% 5.3% 5.4% 2.4% 47.2% 143,159 38.5% 116,583 1.3% 3,858 2.3% 6,859 14,867 Fee and commission income - net 2.3% 6,985 6,626 other operating income share of results from subsidiaries 11,752 share of results from associates 277,531 Total Revenue 48,570 Premium ceded to re- insurers 8.5% 4.2% 25,699 100.0% 21.7% 26.6% 19.1% 29.0% 3.6% 100.0% 117.3% -17.3% 100.0% 303,143 -37,173 100.0% 15.2% -59,704 Net claims 42,753 Interest expences 32.7% -79,922 21.9% -53,647 -68,392 28.0% -65,052 Operating expenses -7,990 Allowance for loan impairment, net of recoverie -224,069 Total Expenses 53,462 Profit befor tax from continuing operations 2.3% -5,527 -244,661 58,482 100.0% 116.7% -16.7% -8,358 -7,891 Income tax expense 100.0% 50,124 45,571 Profit for the year from continuing operation: common size balance sheet for 2016 ,2017, 2018 2019 2018 2017 2016 ASSETS 269,405 Balance with banks and money at call 71,492 Deposits with banks 191,505 212,686 169.531 80,916 121,637 154,036 62,642 43,122 37,462 34,607 Premium and increase balance recivable 19,565 28,129 23,596 26,685 Re-insurance share in insurance funds 242,197 175,799 232,854 200,293 Investment securities 239,635 90,276 Investment in associate Investment in subsidiaries 219,055 72,807 2,006,330 1,826,817 1,642,513 1,590,799 Loans and advances to customers Due from subsidinaries 2,842,790 2,627,245 2,332,799 2,283,557 The current assets 69,296 61,270 52,292 51,299 Other assets 17,043 10,475 Investment properties 2,970 Project work in progress 30,189 Property and equipment 18,054 Intangible assets 112,987 fixed assets 10,776 14,609 3,260 3,399 50,904 36,727 30,896 18,377 16,537 17,298 149,353 134,837 118,494 2,992,143 2,762,082 2,451,293 2,396,544 TOTAL ASSETS EQUITY AND LIABILITIES CAPITAL AND RESERVE 80,777 76,931 69,937 63,579 Share capital 61,036 Share premium Treasury shares 27,523 Legal reserve 13,033 General reserve 43,838 47,684 54,678 -81,464 -81,464 -81,464 - 38,871 34,423 30,714 13,033 13,033 13,033 41,350 33,323 28,567 48,419 Other non- distributable reserves -8,384 64,268 -8,391 64,359 -11,093 59,648 -5,033 Cumulative changes in fair value reserve 32,578 Retained earning 241,135 EQUITY ATTRIBUTABLE TO EQUITY HOI 271,135 perpenture bonds 125,336 non- controling interests 396,471 Total Equity 192,289 179,898 164,020 309,051 309,539 194,020 162,522 154,495 149,514 471,573 464,034 343,534 Liabilities 150,856 Due to banks 1,625,381 Deposits from customer 310,016 238,007 131,811 1,978,832 1,862,768 1,738,428 80,108 78,011 68,179 67,833 Insurance funds 20,000 20,000 20,000 70,000 Subordinated debet 122,467 91,504 143,261 81,037 Other liabilities 2,511,423 2,290,290 2,101,679 1,995,107 the total current liabilities 9,147 7,758 6,080 4,966 Taxation 2,520,570 2,298,048 2,107,759 2,451,293 2,000,073 Total liability 2,396,544 Total Equity and Liabilities 2,992,143 2,762,082 1.3. Calculate net working capital for 4 years. Analyze trends. Calculate Cash Flow from Assets for 4 years. Analyze trends. the real balance sheet for Omnivest 2016| ASSETS 2019 2018 2017 269,405 Balance with banks and money at call 71,492 Deposits with banks 34,607 Premium and increase balance recivable 26,685 Re-insurance share in insurance funds 200,293 Investment securities 90,276 Investment in associate 191,505 212,686 169,531 80,916 62,642 121,637 43,122 28,129 154,036 37,462 19,565 23,596 242,197 239,635 175,799 219,055 232,854 72,807 Investment in subsidiaries 2,006,330 1,826,817 1,642,513 1,590,799 Loans and advances to customers Due from subsidinaries 69,296 10,776 61,270 52,292 51,299 Other assets 10,475 Investment properties 2,970 Project work in progress 30,189 Property and equipment 18,054 Intangible assets 2,396,544 TOTAL ASSETS 17,043 14,609 3,399 3,260 50,904 30,896 17,298 36,727 18,377 16,537 2,992,143 2,762,082 2,451,293 EQUITY AND LIABILITIES CAPITAL AND RESERVE 63,579 Share capital 61,036 Share premium 80,777 76,931 69,937 43,838 47,684 54,678 -81,464 -81,464 - Treasury shares 27,523 Legal reserve 13,033 General reserve -81,464 38,871 34,423 30,714 13,033 41,350 13,033 13,033 33,323 48,419 Other non- distributable reserves -5,033 Cumulative changes in fair value reserve 32,578 Retained carning 241,135 EQUITY ATTRIBUTABLE TO EQUITY HOLDERS 271,135 perpenture bonds 125,336 non- controling interests 396,471 Total Equity Liabilities 28,567 -8,384 -8,391 -11,093 64,268 64,359 59,648 179,898 192,289 309,051 164,020 194,020 309,539 154,495 162,522 149,514 471,573 464,034 343,534 310,016 1,978,832 80,108 238,007 131,811 150,856 Due to banks 1,625,381 Deposits from customer 67,833 Insurance funds 70,000 Subordinated debet 81,037 Other liabilities 1,862,768 1,738,428 78,011 20,000 68,179 20,000 20,000 122,467 91,504 143,261 9,147 7,758 6,080 4,966 Taxation 2,298,048 2,000,073 Total liability 2,396,544 Total Equity and Liabilities 2,520,570 2,107,759 2,451,293 2,992,143 2,762,082 COMMON SIZE INCOME STATEMENT FOR 2016 & 2017 2016| Continuing Operation 95,953 Gross premium earned 2017 2016 2017 44.1% 36.1% 4.8% 8.3% 3.0% 48.9% 116,098 37.7% 89,598 78,604 Interst income 3,272 14,214 10,373 Investment income - net 18,055 Fee and commission income - net 6,561 other operating income 1.4% 6.0% 3.0% 7,203 share of results from subsidiaries 3.7% 100.0% 20.7% 2.9% 6,996 7,985 share of results from associates 217.531 Total Revenue -38,566 Premium ceded to re- insurers -48,466 Net claims -30,244 Interest expences -59,003 Operating expenses 237,381 100.0% 23.2% -45,817 27.1% 26.0% -53,557 -37,608 -60,318 19.0% 16.2% 30.5% 31.7% provision for impairment of due from a subsidia -2,411 provision for impairment of project work in pro -7,697 Allowance for loan impaiment, net of recoverie -186,369 Total Expenses 31,162 Profit befor tax from continuing operations -3,469 Income tax expense 1.3% 4.1% 0.1% -144 100.0% 100.0% -197,444 39,937 118.8% 112.5% -18.8% -12.5% -6,315 100.0% 33,622 27,693 Profit for the year from continuing operation 100.0% COMMON SIZE INCOME STATEMENT FOR 2018 & 2019 2,019| 2018 Continuing Operation 127,389 Gross premium earned 102,237 Interst income 14,660 Investment income - net 2019 2018 45.9% 36.8% 5.3% 5.4% 2.4% 47.2% 143,159 38.5% 116,583 1.3% 3,858 2.3% 6,859 14,867 Fee and commission income - net 2.3% 6,985 6,626 other operating income share of results from subsidiaries 11,752 share of results from associates 277,531 Total Revenue 48,570 Premium ceded to re- insurers 8.5% 4.2% 25,699 100.0% 21.7% 26.6% 19.1% 29.0% 3.6% 100.0% 117.3% -17.3% 100.0% 303,143 -37,173 100.0% 15.2% -59,704 Net claims 42,753 Interest expences 32.7% -79,922 21.9% -53,647 -68,392 28.0% -65,052 Operating expenses -7,990 Allowance for loan impairment, net of recoverie -224,069 Total Expenses 53,462 Profit befor tax from continuing operations 2.3% -5,527 -244,661 58,482 100.0% 116.7% -16.7% -8,358 -7,891 Income tax expense 100.0% 50,124 45,571 Profit for the year from continuing operation: common size balance sheet for 2016 ,2017, 2018 2019 2018 2017 2016 ASSETS 269,405 Balance with banks and money at call 71,492 Deposits with banks 191,505 212,686 169.531 80,916 121,637 154,036 62,642 43,122 37,462 34,607 Premium and increase balance recivable 19,565 28,129 23,596 26,685 Re-insurance share in insurance funds 242,197 175,799 232,854 200,293 Investment securities 239,635 90,276 Investment in associate Investment in subsidiaries 219,055 72,807 2,006,330 1,826,817 1,642,513 1,590,799 Loans and advances to customers Due from subsidinaries 2,842,790 2,627,245 2,332,799 2,283,557 The current assets 69,296 61,270 52,292 51,299 Other assets 17,043 10,475 Investment properties 2,970 Project work in progress 30,189 Property and equipment 18,054 Intangible assets 112,987 fixed assets 10,776 14,609 3,260 3,399 50,904 36,727 30,896 18,377 16,537 17,298 149,353 134,837 118,494 2,992,143 2,762,082 2,451,293 2,396,544 TOTAL ASSETS EQUITY AND LIABILITIES CAPITAL AND RESERVE 80,777 76,931 69,937 63,579 Share capital 61,036 Share premium Treasury shares 27,523 Legal reserve 13,033 General reserve 43,838 47,684 54,678 -81,464 -81,464 -81,464 - 38,871 34,423 30,714 13,033 13,033 13,033 41,350 33,323 28,567 48,419 Other non- distributable reserves -8,384 64,268 -8,391 64,359 -11,093 59,648 -5,033 Cumulative changes in fair value reserve 32,578 Retained earning 241,135 EQUITY ATTRIBUTABLE TO EQUITY HOI 271,135 perpenture bonds 125,336 non- controling interests 396,471 Total Equity 192,289 179,898 164,020 309,051 309,539 194,020 162,522 154,495 149,514 471,573 464,034 343,534 Liabilities 150,856 Due to banks 1,625,381 Deposits from customer 310,016 238,007 131,811 1,978,832 1,862,768 1,738,428 80,108 78,011 68,179 67,833 Insurance funds 20,000 20,000 20,000 70,000 Subordinated debet 122,467 91,504 143,261 81,037 Other liabilities 2,511,423 2,290,290 2,101,679 1,995,107 the total current liabilities 9,147 7,758 6,080 4,966 Taxation 2,520,570 2,298,048 2,107,759 2,451,293 2,000,073 Total liability 2,396,544 Total Equity and Liabilities 2,992,143 2,762,082 1.3. Calculate net working capital for 4 years. Analyze trends. Calculate Cash Flow from Assets for 4 years. Analyze trends.
Step by Step Solution
3.48 Rating (165 Votes )
There are 3 Steps involved in it
Calculate net working capital for 4 years The following table shows net working capital for Omnivest ... View full answer

Get step-by-step solutions from verified subject matter experts