

Question: Two alternative designs have been proposed for processing customers in a service center. To compare the performance of the two alternative system designs, we generated
Two alternative designs have been proposed for processing customers in a service center. To compare the performance of the two alternative system designs, we generated 10 days of customer traffic, where a day's traffic consists of a new simulated sequence of customer arrival times and the associated service times (in other words, 10 independent replications). For day 1 of simulated operation, we ran the traffic through the system operating under design A to compute the average time in system for all the customers processed on that day/replication. Day I's traffic is also run through the system operating under design B to compute the average time in system for all the customers processed on that day/replication. The process was repeated for all 10 days of simulated traffic, yielding average time in system (in minutes) for all the customers processed on each day as follows:
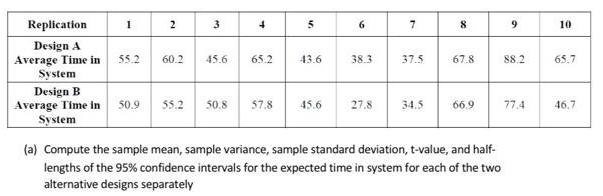

Replication 3 8 4 6 10 Design A Average Time in System 55.2 60.2 45.6 65.2 43.6 38.3 37.5 67.8 88.2 65.7 Design B Average Time in System 50.9 55.2 50.8 57.8 45.6 27.8 34.5 66.9 77.4 46,7 (a) Compute the sample mean, sample variance, sample standard deviation, t-value, and half- lengths of the 95% confidence intervals for the expected time in system for each of the two alternative designs separately
Step by Step Solution
3.47 Rating (157 Votes )
There are 3 Steps involved in it
Rellinotion 1 2 34 16 Design A Ave roge time in sysdem S32 GOL4S 6652456383 31 5678 ... View full answer

Get step-by-step solutions from verified subject matter experts