

Question: Accounting100! Please help! Leverage Indicators (at year-end) Interest Coverage Use the information in Home Depot's Fiscal 2018 Balance Sheet and Income Statement to calculate the
Accounting100! Please help!
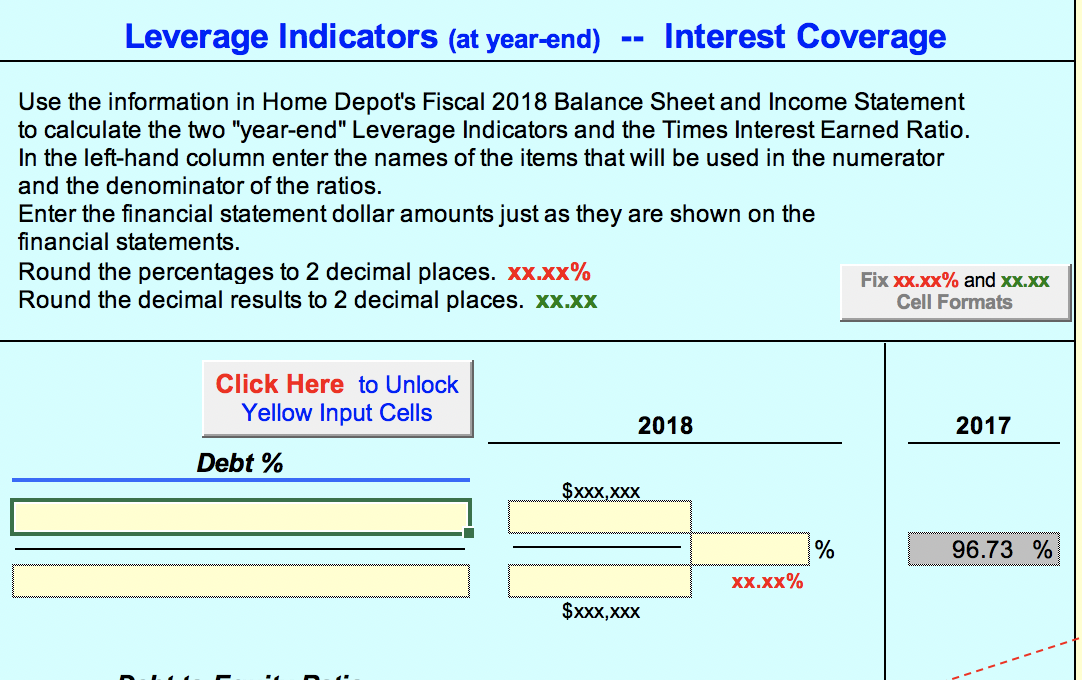
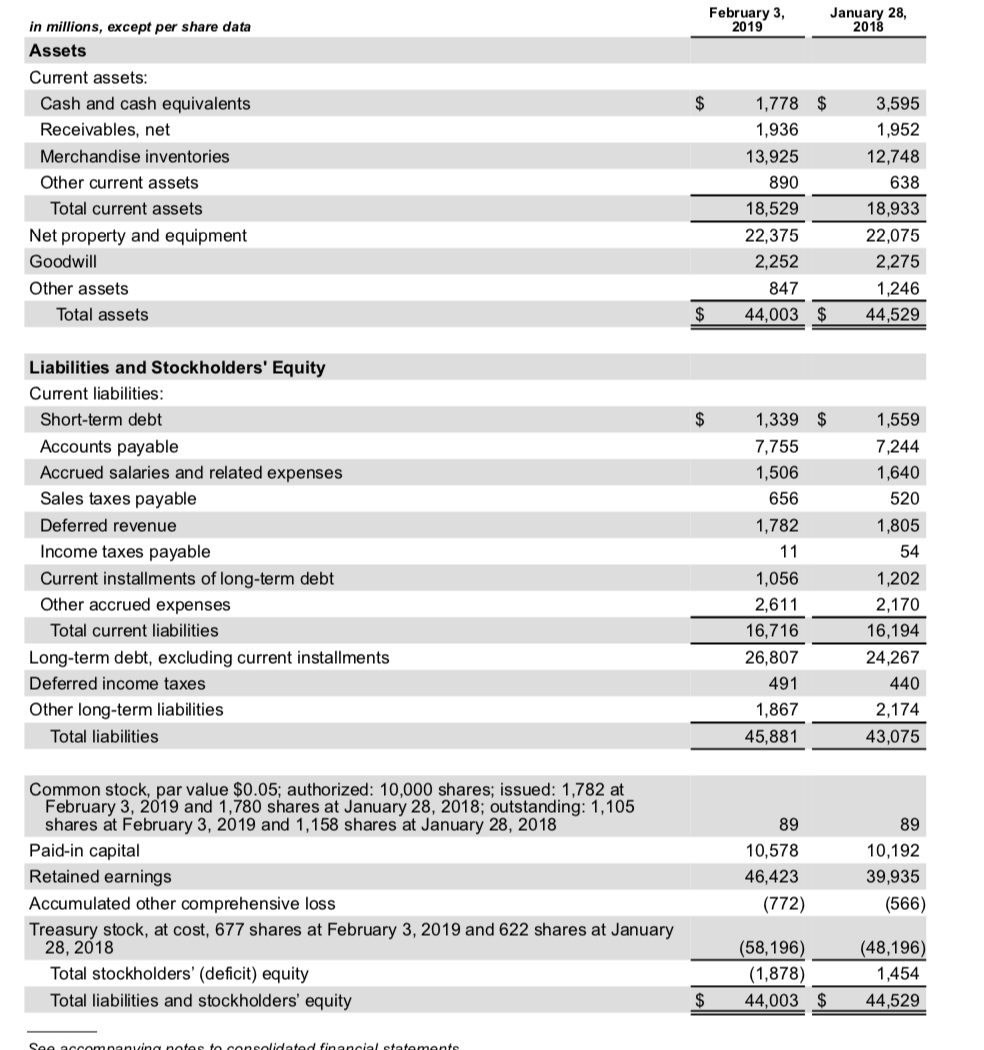
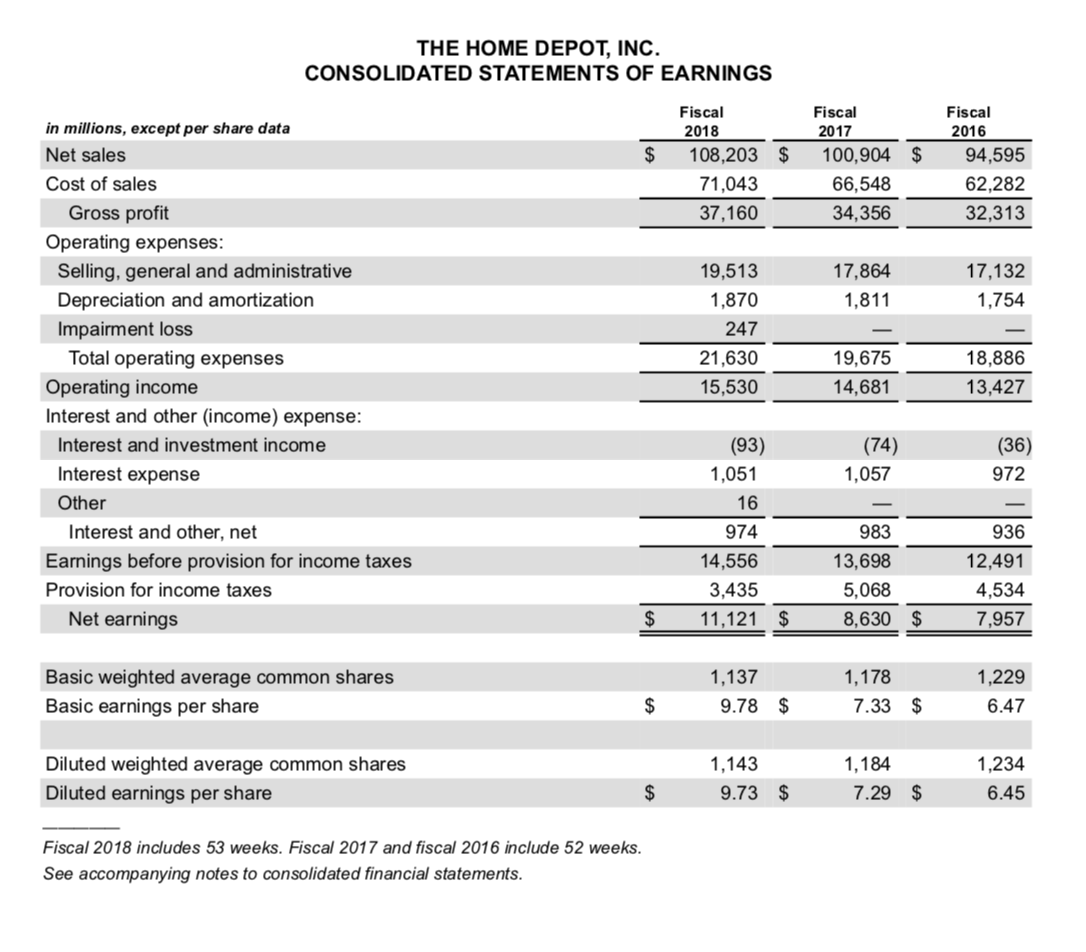
Leverage Indicators (at year-end) Interest Coverage Use the information in Home Depot's Fiscal 2018 Balance Sheet and Income Statement to calculate the two "year-end" Leverage Indicators and the Times Interest Earned Ratio. In the left-hand column enter the names of the items that will be used in the numerator and the denominator of the ratios. Enter the financial statement dollar amounts just as they are shown on the financial statements. Round the percentages to 2 decimal places. xx.xx% Fix xx.xx% and XX.XX Round the decimal results to 2 decimal places. XX.XX Cell Formats Click Here to Unlock Yellow Input Cells 2018 2017 Debt % $XXX,XXX % 96.73 % Xx.xx% $xxx,XXX February 3, 2019 January 28, 2018 $ in millions, except per share data Assets Current assets: Cash and cash equivalents Receivables, net Merchandise inventories Other current assets Total current assets Net property and equipment Goodwill Other assets Total assets 1,778 $ 1,936 13,925 890 18,529 22,375 2,252 847 44,003 $ 3,595 1,952 12,748 638 18,933 22,075 2,275 1,246 44,529 $ $ Liabilities and Stockholders' Equity Current liabilities: Short-term debt Accounts payable Accrued salaries and related expenses Sales taxes payable Deferred revenue Income taxes payable Current installments of long-term debt Other accrued expenses Total current liabilities Long-term debt, excluding current installments Deferred income taxes Other long-term liabilities Total liabilities 1,339 $ 7,755 1,506 656 1,782 11 1,056 2,611 16,716 26,807 491 1,867 45,881 1,559 7,244 1,640 520 1,805 54 1,202 2,170 16,194 24,267 440 2,174 43,075 89 89 Common stock, par value $0.05; authorized: 10,000 shares; issued: 1,782 at February 3, 2019 and 1,780 shares at January 28, 2018; outstanding: 1,105 shares at February 3, 2019 and 1,158 shares at January 28, 2018 Paid-in capital Retained earnings Accumulated other comprehensive loss Treasury stock, at cost, 677 shares at February 3, 2019 and 622 shares at January 28, 2018 Total stockholders' (deficit) equity Total liabilities and stockholders' equity 10,578 46,423 (772) 10,192 39,935 (566) (58,196) (1,878) 44,003 $ (48,196) 1,454 44,529 $ Sao ancomnanvina nates to consolidated financial statemente THE HOME DEPOT, INC. CONSOLIDATED STATEMENTS OF EARNINGS $ Fiscal 2018 108,203 $ 71,043 37,160 Fiscal 2017 100,904 $ 66,548 34,356 Fiscal 2016 94,595 62,282 32,313 17,864 1,811 17,132 1,754 in millions, except per share data Net sales Cost of sales Gross profit Operating expenses: Selling, general and administrative Depreciation and amortization Impairment loss Total operating expenses Operating income Interest and other (income) expense: Interest and investment income Interest expense Other Interest and other, net Earnings before provision for income taxes Provision for income taxes Net earnings 19,513 1,870 247 21,630 15,530 19,675 14,681 18,886 13,427 (74) 1,057 (36) 972 (93) 1,051 16 974 14,556 3,435 11,121 $ 983 936 13,698 5,068 8,630 $ 12,491 4,534 7,957 $ Basic weighted average common shares Basic earnings per share 1,137 9.78 $ 1,178 7.33 $ 1,229 6.47 $ Diluted weighted average common shares Diluted earnings per share 1,143 9.73 $ 1,184 7.29 $ 1,234 6.45 $ Fiscal 2018 includes 53 weeks. Fiscal 2017 and fiscal 2016 include 52 weeks. See accompanying notes to consolidated financial statements
Step by Step Solution
There are 3 Steps involved in it

Get step-by-step solutions from verified subject matter experts