

Question: ACCT-1071 Case Study #2 - Vera's Magic Garden Ltd.Appendix A: Notes from Client MeetingThe following information was provided by the owner of Vera's Magic Garden
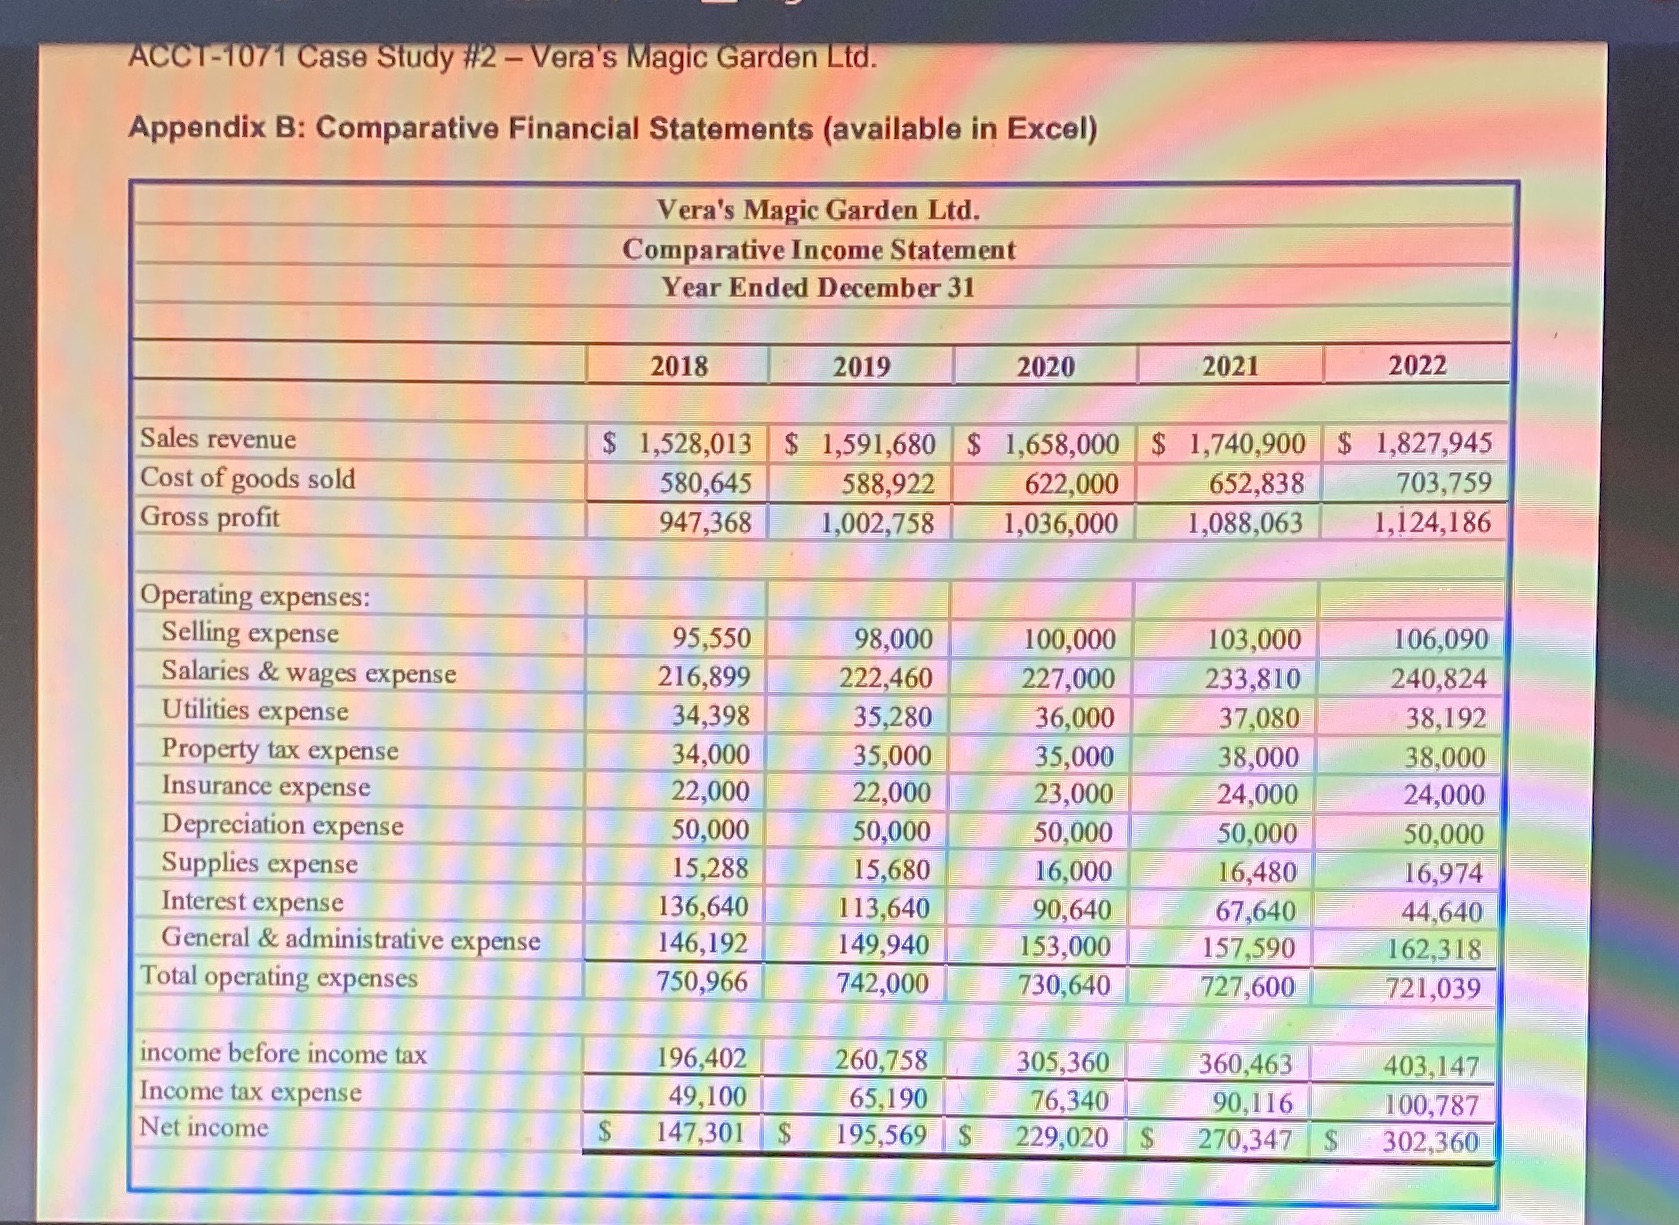
ACCT-1071 Case Study #2 - Vera's Magic Garden Ltd.Appendix A: Notes from Client MeetingThe following information was provided by the owner of Vera's Magic Garden Ltd. detailing expectedsales, collections, purchases, expenditures, payments and financing for the fiscal year, January 01 .December 31, 2023.Sales are expected to increase by 5% over 2022 and historically have been earned as follows:January - March, October & November0%April15%May30%June25%July10%August & September (each month)5%December10%Total sales100%Most sales are cash (30%) and credit card (60%); however, we do some corporate sales (10%) thatare billed and collected the following month. Credit card sales are deposited directly to our bankaccount the next business day less a 4% transaction fee. The only exception to this pattern isDecember with sales of holiday wreathes and arrangements that are mainly corporate (80%) with thebalance from cash sales.Purchases & Cost of Goods SoldPurchases are approximately 35% of total sales. Orders are made in February and a 20% deposit ispayable in March. Approximately 60% of orders arrive during April and the balance arrive in early Maywith the balance owing paid 60 days following receipt. An additional purchase of $35,000 is plannedfor November for the holiday season and is payable the following January.Although purchases are approximately 35% of sales, cost of goods sold is approximately 38% ofsales due to plant loss and end-of-season scrap. Annuals not sold during the season are scrapped asthe cost of overwintering cannot be recovered; therefore, inventory consists of pots, soil, fertilizer,trees, shrubs, and perennials that are overwintered for sale next year.ACCT-1071 Case Study #2 - Vera's Magic Garden Ltd.Expenses & Financing1- Principal payments of $200,000 plus 10% interest on the year end loan balance is payable onJanuary Of each year.2 pM Janiah yremia,-y.860 000 pius 6% intsrest on the year and mortgage balance is payable3. We have negotiated an increase of $450,000 to the existing loan to finance new greenhousesthat will be built during the slow period of August - OctoberThe insurance policy is renewed on July 1st each year at a cost of $24,000.5. Property taxes for 2023 will be $38,000 paid in January.6. Salaries and wages are expected to increase to $240,000, paid as follows;1) 50% of salaries and wages expense is incurred during peak season April - July, paidevenly throughout each month.2) 30% of salaries and wages expense is incurred during March, August, September, andOctober, paid evenly throughout each month.3) 20% of salaries and wages expense is incurred during January. February. November and December, paid evenly throughout each month7. All other expenses. other than deprecation and incame tax are expected to increase by 3%8. Selling expense, supplies expense and general/administrative expense follow the samepattern as salaries and wages expense.10. Dividends of $30,000 will be paid in December.11. The corporation plans to buyout the shares of one of the original investors at a cost of $200;000 in June.12. Vera's has access to a $500,000 line of credit to cover short-term cash needs at an annualinterest rate of 6%. Excess cash is immediately used to repay the line of credit balance and interest charges are payable the following month on the prior month's ending balance.
Step by Step Solution
There are 3 Steps involved in it

Get step-by-step solutions from verified subject matter experts