

Question: Accumulating Change (must use excel) 0.00, 3874.36 2.00, 5644.36 4.00, 7045.67 6.00, 7808.36 8.00, 7833.67 10.00, 7220.37 12.00, 6238.37 14.00, 5256.37 16.00, 4643.07 18.00, 4668.36
 Accumulating Change (must use excel)
0.00, 3874.36
2.00, 5644.36
4.00, 7045.67
6.00, 7808.36
8.00, 7833.67
10.00, 7220.37
12.00, 6238.37
14.00, 5256.37
16.00, 4643.07
18.00, 4668.36
20.00, 5431.06
22.00, 6832.35
24.00, 8602.35
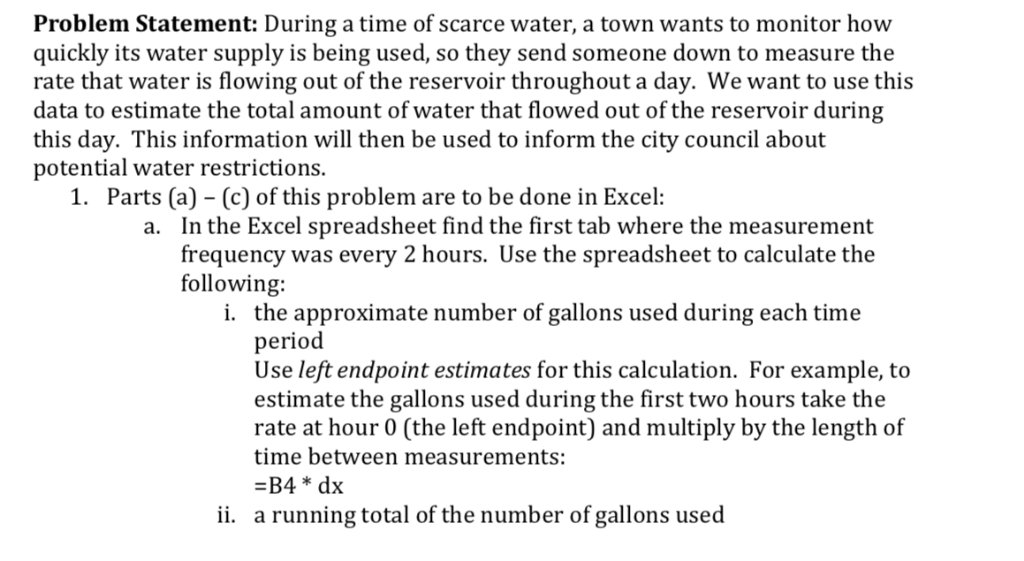
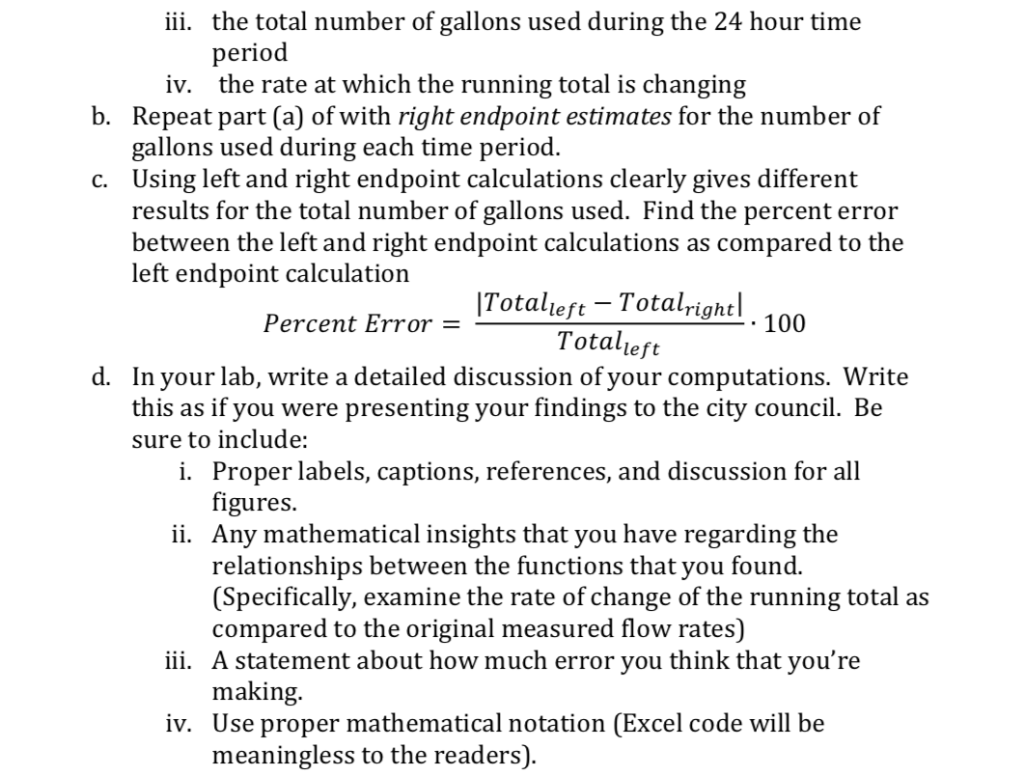
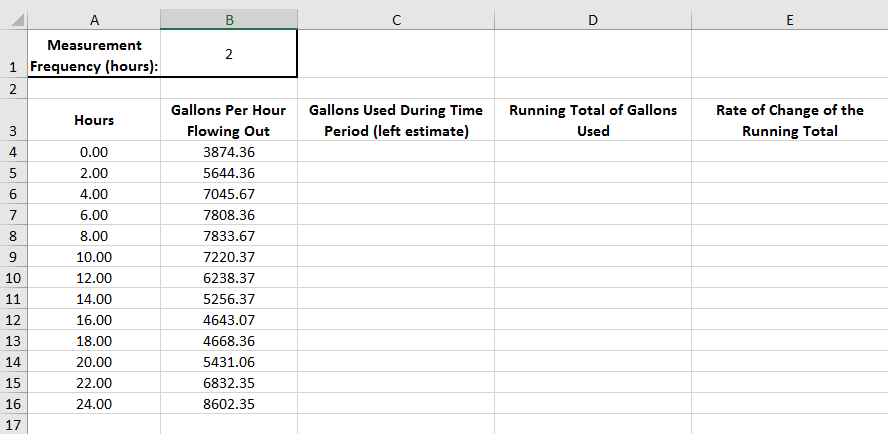
Problem Statement: During a time of scarce water, a town wants to monitor how quickly its water supply is being used, so they send someone down to measure the rate that water is flowing out of the reservoir throughout a day. We want to use this data to estimate the total amount of water that flowed out of the reservoir during this day. This information will then be used to inform the city council about potential water restrictions. 1. Parts (a) - (c) of this problem are to be done in Excel: In the Excel spreadsheet find the first tab where the measurement frequency was every 2 hours. Use the spreadsheet to calculate the following: a. the approximate number of gallons used during each time period i. e left endpoint estimates for this calculation. For example, to estimate the gallons used during the first two hours take the rate at hour 0 (the left endpoint) and multiply by the length of time between measurements: -B4 * dx a running total of the number of gallons used ii. the total number of gallons used during the 24 hour time period the rate at which the running total is changing iii. iv. Repeat part (a) of with right endpoint estimates for the number of gallons used during each time period Using left and right endpoint calculations clearly gives different results for the total number of gallons used. Find the percent error between the left and right endpoint calculations as compared to the left endpoint calculation b. c. Totalieft- Totalrightl Totalieft Percent Error- 100 d. In your lab, write a detailed discussion of your computations. Write this as if you were presenting your findings to the city council. Be sure to include: i. Proper labels, captions, references, and discussion for all figures. ii. Any mathematical insights that you have regarding the relationships between the functions that vou found. (Specifically, examine the rate of change of the running total as compared to the original measured flow rates) iii. A statement about how much error you think that you're making. athematical notation (Excel code will be meaningless to the readers) Measurement 1 Frequency (hours) Gallons Per Hour Flowing Out 3874.36 5644.36 7045.67 7808.36 7833.67 7220.37 6238.37 5256.37 4643.07 4668.36 5431.06 6832.35 8602.35 Gallons Used During Time Period (left estimate) Running Total of Gallons Used Rate of Change of the Running Total Hours 4 0.00 2.00 4.00 6.00 8.00 10.00 12.00 14.00 16.00 18.00 20.00 22.00 24.00 10 12 13 14 15 16 17 Problem Statement: During a time of scarce water, a town wants to monitor how quickly its water supply is being used, so they send someone down to measure the rate that water is flowing out of the reservoir throughout a day. We want to use this data to estimate the total amount of water that flowed out of the reservoir during this day. This information will then be used to inform the city council about potential water restrictions. 1. Parts (a) - (c) of this problem are to be done in Excel: In the Excel spreadsheet find the first tab where the measurement frequency was every 2 hours. Use the spreadsheet to calculate the following: a. the approximate number of gallons used during each time period i. e left endpoint estimates for this calculation. For example, to estimate the gallons used during the first two hours take the rate at hour 0 (the left endpoint) and multiply by the length of time between measurements: -B4 * dx a running total of the number of gallons used ii. the total number of gallons used during the 24 hour time period the rate at which the running total is changing iii. iv. Repeat part (a) of with right endpoint estimates for the number of gallons used during each time period Using left and right endpoint calculations clearly gives different results for the total number of gallons used. Find the percent error between the left and right endpoint calculations as compared to the left endpoint calculation b. c. Totalieft- Totalrightl Totalieft Percent Error- 100 d. In your lab, write a detailed discussion of your computations. Write this as if you were presenting your findings to the city council. Be sure to include: i. Proper labels, captions, references, and discussion for all figures. ii. Any mathematical insights that you have regarding the relationships between the functions that vou found. (Specifically, examine the rate of change of the running total as compared to the original measured flow rates) iii. A statement about how much error you think that you're making. athematical notation (Excel code will be meaningless to the readers) Measurement 1 Frequency (hours) Gallons Per Hour Flowing Out 3874.36 5644.36 7045.67 7808.36 7833.67 7220.37 6238.37 5256.37 4643.07 4668.36 5431.06 6832.35 8602.35 Gallons Used During Time Period (left estimate) Running Total of Gallons Used Rate of Change of the Running Total Hours 4 0.00 2.00 4.00 6.00 8.00 10.00 12.00 14.00 16.00 18.00 20.00 22.00 24.00 10 12 13 14 15 16 17
Step by Step Solution
There are 3 Steps involved in it

Get step-by-step solutions from verified subject matter experts