

Question: > AClick Submit to complete this assessment. Question 12 The table below summarises data including number of deaths and total number of patients from a
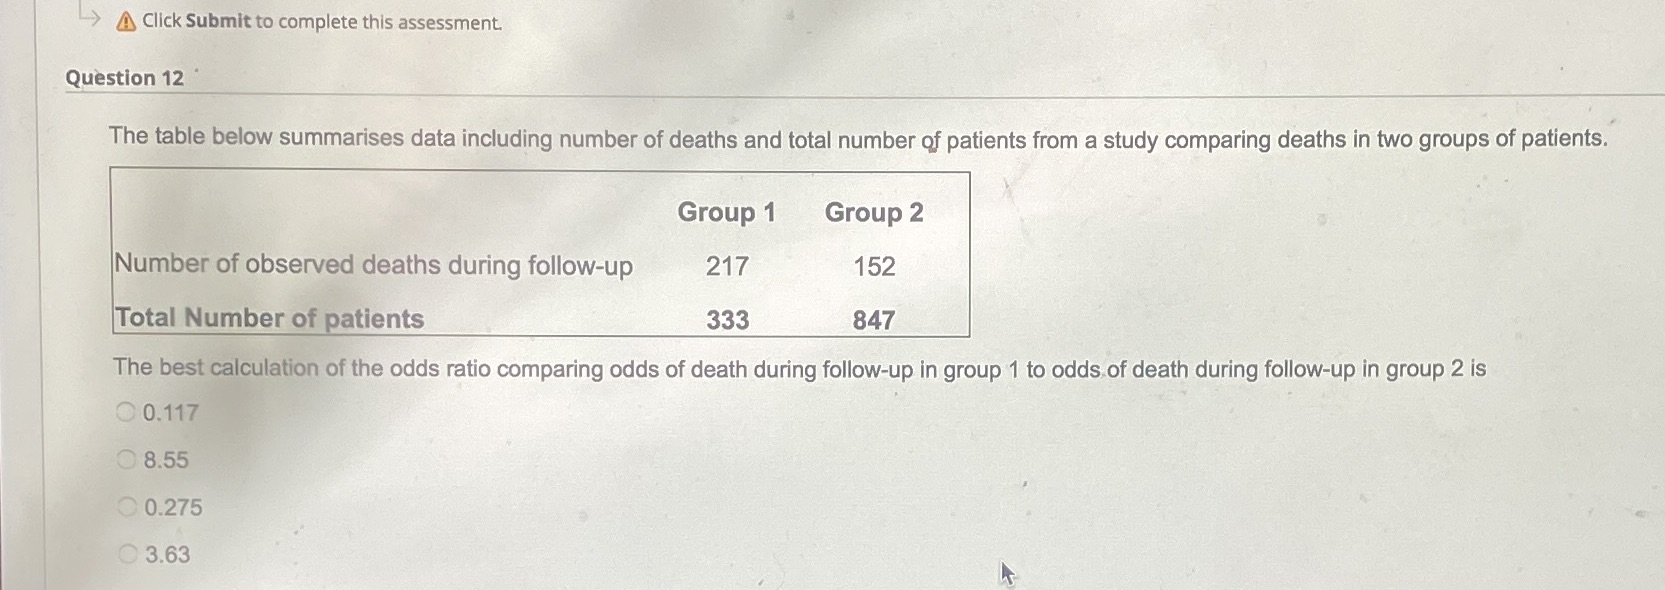
> AClick Submit to complete this assessment. Question 12 The table below summarises data including number of deaths and total number of patients from a study comparing deaths in two groups of patients. Group 1 Group 2 Number of observed deaths during follow-up 217 152 Total Number of patients 333 847 The best calculation of the odds ratio comparing odds of death during follow-up in group 1 to odds of death during follow-up in group 2 is C 0.117 O 8.55 0.275 3.63
Step by Step Solution
There are 3 Steps involved in it
1 Expert Approved Answer
Step: 1 Unlock

Question Has Been Solved by an Expert!
Get step-by-step solutions from verified subject matter experts
Step: 2 Unlock
Step: 3 Unlock