

Question: Activity 1 1 . 1 2 Selecting Graphics Identify the best graphic forms to illustrate the following data. table [ [ , ,
Activity Selecting Graphics
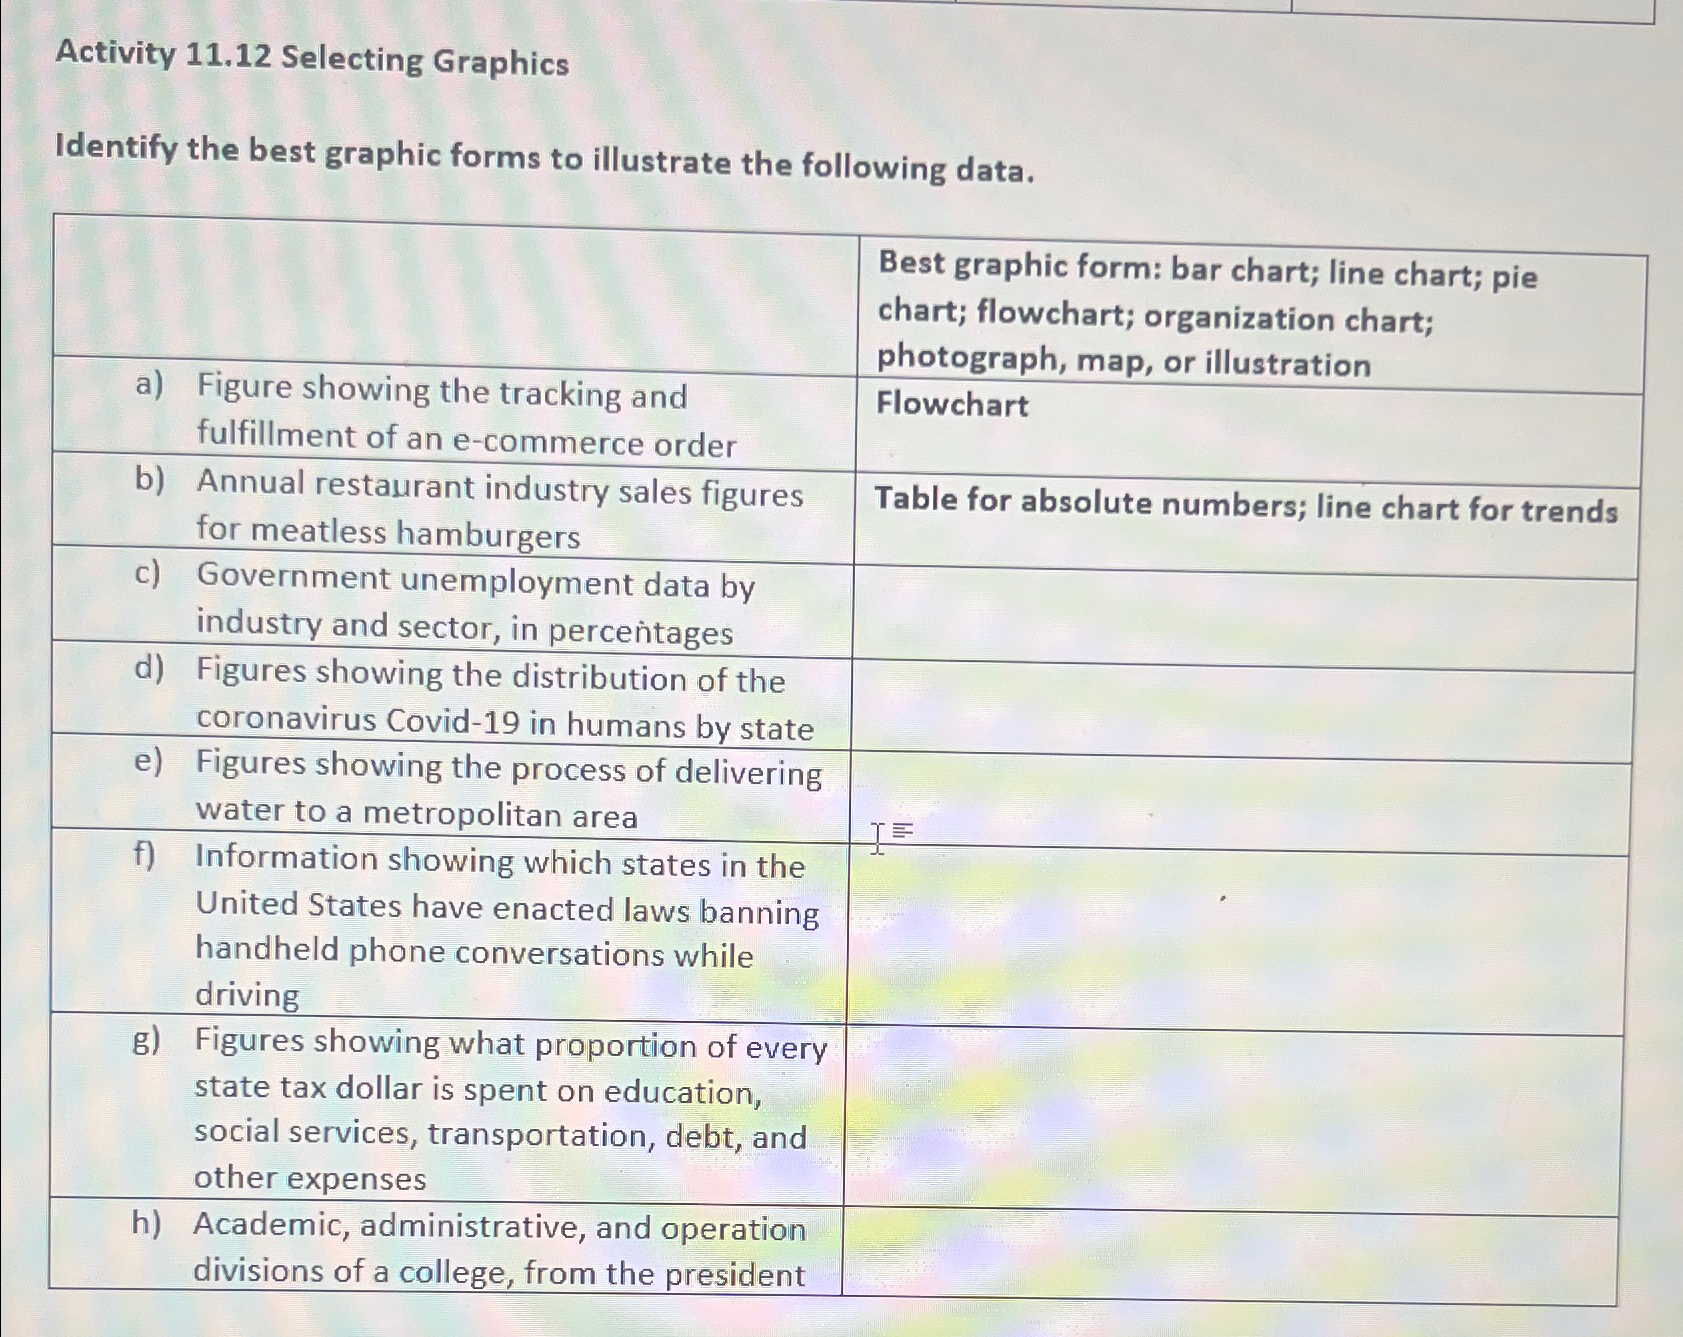
Identify the best graphic forms to illustrate the following data.
tabletableBest graphic form: bar chart; line chart; piechart; flowchart; organization chart;photograph map, or illustrationatableFigure showing the tracking andfulfillment of an ecommerce orderFlowchartbtableAnnual restaurant industry sales figuresfor meatless hamburgersTable for absolute numbers; line chart for trendsctableGovernment unemployment data byindustry and sector, in percentagesdtableFigures showing the distribution of thecoronavirus Covid in humans by stateetableFigures showing the process of deliveringwater to a metropolitan area
Step by Step Solution
There are 3 Steps involved in it
1 Expert Approved Answer
Step: 1 Unlock

Question Has Been Solved by an Expert!
Get step-by-step solutions from verified subject matter experts
Step: 2 Unlock
Step: 3 Unlock